What's My Firewall Telling Me? (Part 4)
There’s been a lot of discussion about the recent stories on parsing firewall logs - Mark’s story at http://isc.sans.org/diary.html?storyid=8293 , Daniel’s story at http://isc.sans.org/diary.html?storyid=8347 , and Kyle’s at http://isc.sans.org/diary.html?storyid=8362 have covered a number of methods and tools for plumbing the depths of your firewall logs.
In these stories, it’s been stressed that there’s gold in them there logs! Reviewing your logs is legally required under several regulatory frameworks, and just plain makes sense – reviewing inbound and outbound traffic is an excellent way to find stuff being sent or received that shouldn’t be happening, finding malware or finding violations of corporate policies.
But, you say, that’s all great, but many firewall logs are over 500MB per day, and if you're not a command line guru with grep, uniq, sort, awk or perl, what do you do? Or what if the firewall log output is just so much scrambled eggs to you? How are you supposed to plow through all that text and data for the few pearls that you can expect to find that might indicate a problem? For me, the answer is easy, use tools that summarize Netflow data. Netflow is a facility that is available on many network devices that examines all the traffic through the device interfaces, and summarizes it by source and destination IP address, as well as source and destination port and how much data was sent or received.. It then sends this summarized data to a server application called a Netflow Collector. Netflow is generally associated with Cisco gear, but there is an RFC equivalent in sFlow (RFC 3176) that is implemented by many other vendors, or a Juniper specific version in jFlow.
Continuing on, the Netflow collector then stashes this data into a database, and then gives you a nice web front-end to the data, allowing you to slice and dice the addresses and associated values in prepackaged reports, or do ad-hoc queries. So if you want to see why internet bandwidth was maxed out last Tuesday over lunch, who the culprit was and what they were doing, it’s a piece of easy!
It sounds complicated, but in practice it’s generally about 4-5 lines of config on the device (router, switch or firewall - check your documentation for specifics), and a GUI setup on the server. There are lots of Netflow Collector apps out there, I won’t start the religious war of stating that one is better than another – I use any one of 7 or 8 different ones, depending on which client I’m working with that day.
Let’s take a look at a typical “let’s review the firewall activity” session that you might have as part of your daily routine. This data is from a client site where I set Netflow up last week, I was going through an orientation session with the client IT Team (which is also the Incident Handling team at this organization), as well as using the tool in response to widespread user complaints about internet performance issues.
Let’s start at the TCP applications (aka sort data by TCP destination port) screen – in this example we’re just looking at the data from the last hour, for the inside interface of the firewall.
.png)
On the face of it, all looks well, all the usual suspects are there, but let’s dig a bit deeper – let’s take a closer look at SMTP.
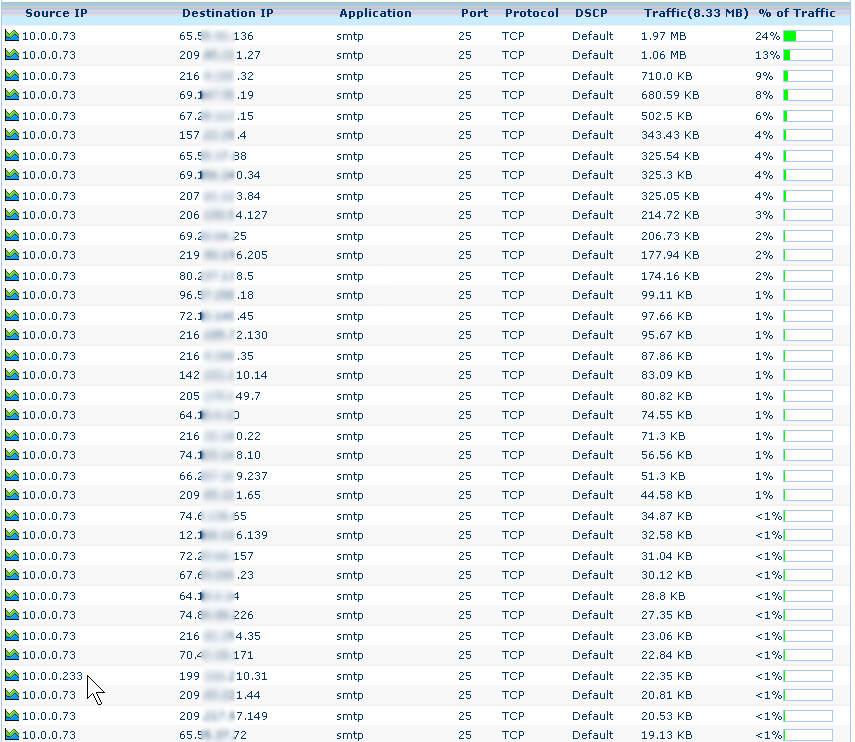
The SMTP traffic looks pretty much as we expected – lots and lots of mail being sent from the mail server ( 10.0.0.73 ). But hey – what’s that station 10.0.0.233? - should there be another SMTP sender? After some digging, it turns out we had a workstation using a personal POP/SMTP email client from work – this was a clear violation of the Acceptable Use Policy at this organization.
Let’s go back to the main screen, and dig into the “TCP_App” section, which is the "bit bucket" that this particular Netflow application puts things into when it doesn’t recognize what the target tcp port is.
Jackpot! What we have here is a number of stations, all running peer-to-peer applications (each line is a different target ip address). This was no surprise two days after the Oscars, but this is another clear violation of this Organization’s Acceptable Use Policy, and one of the best ways to introduce malware into the Organization as well. Not only that, it takes LOTS of bandwidth and LOTS of address translation resources (aka memory) at the firewall – sessions like this can easily affect Internet performance for the entire corporation. Depending on the country, this might be a great way to get sued under copyright infringement as well !
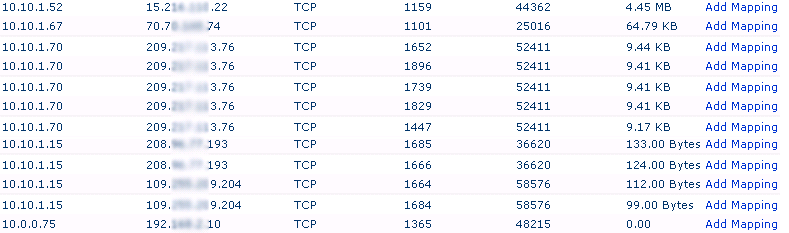
Now let’s look at the data a bit differently – let’s look at session totals over the last hour by IP address, sorted by volume.
.png)
Take a look at that first line – that’s a station on the inside, using an “anonymizer” proxy out on the internet (tcp/8080). OUCH – that’s someone who is not only violating policy, they’re knowingly trying to cloak their actions. They’re also the heaviest user in the last hour. Again, we’re 2 days after the Oscars, so it’s no mystery what that 200mb session is all about. But on any other week, there would be a real chance of finding some “call the cops” type illegal activity going on with proxy sessions like this.
Needless to say, after this short exploration, we're working on a egress filter for this firewall. The "we trust our users" position not only ignores the fact that even if you trust your users, trusting your users' malware should be part of your business model, but as you can see from this, you can't trust (all of) your users either.
You can see from this that using a good Netflow Collector application will give you a great window into the traffic transiting your firewall or router, pretty much as granular as you want to be. We collected all this data in about 10 minutes, running a tutorial for the IT group at the same time. I still use grep, awk and the rest more than I use Netflow, but a good Netflow app can give you nice management style reports, historical queries into your router or firewall data and really granular analysis with almost no time investment. If you're not a "CLI person", Netflow can go a long way towards getting you really deep into your firewall activity.
=============== Rob VandenBrink, Metafore ==============


Comments
When you look at your flow data you will see most of the URL of the request, along with the web-servers reply code (and not much more...)
You can tweak the 32-byte snaplen value to find your verbosity/disk-space/privacy sweet-spot.
This is great for post-exploitation forensics, without burning up too much disk-space.
On a shared network however, users need to be made aware of the monitoring, and it should be used ethically.
Chris
Mar 10th 2010
1 decade ago
It allows for creating rules once instead of having to grep for them.
Also, in more complex environments you'll be able to correlate events... http://www.ossec.net
Bart
Mar 10th 2010
1 decade ago
Chris
Mar 10th 2010
1 decade ago
sophie03903
Mar 10th 2010
1 decade ago
I looked into flow-tools for Ubuntu, but I couldn't find any decent information on how to set it up with a single server acting as a router. If you could assist, it would be most appreciated.
Thank you in advance
-Jeff
Raider
Mar 11th 2010
1 decade ago
Rob VandenBrink
Mar 11th 2010
1 decade ago
Thank you
-Jeff
Raider
Mar 11th 2010
1 decade ago
I'm able to use the same tools to analyze the data. Setup on the collector is no different then if it was coming from a Cisco router.
Tim
Mar 11th 2010
1 decade ago
ProtocolGeek
Mar 11th 2010
1 decade ago
kurtsecure
Mar 12th 2010
1 decade ago