Keep an Eye on Your WMI Logs
WMI (“Windows Management Instrumentation”)[1] is, like Microsoft says, "the infrastructure for management data and operations on Windows-based operating systems". Personally, I like to make a (very) rough comparison between WMI and SNMP: You can query information about a system (read) but also alter it (write). WMI is present on Windows systems since the version Windows 2000. As you can imagine, when a tool is available by default on all systems, it’s a good opportunity for attackers to (ab)use of its features. Think about tools like bitsadmin.exe or certutil.exe that are used by many malicious scripts. Today, WMI seems to be more and more used in many scenarios. Here are two examples:
I found a malicious Powershell script that uses WMI to extract the name of the installed antivirus and later exfiltrate it (so the attacker gets an overview of the infected system). It’s very simple:
$AV = (WMIC /Node:localhost /Namespace:\\root\SecurityCenter2 Path AntiVirusProduct Get displayName /format:csv)|Out-String
The above command generates an output looks like:
PS C:\Users\isc> (WMIC /Node:localhost /Namespace:\\root\SecurityCenter2 Path AntivirusProduct Get displayname /format:csv)

Node,displayName

WIN10ESX,Windows Defender
‘WMIC’ is the command line tool provided by Microsoft to interact with the WMI service.
The second example is more interesting. In a recent article on the ESET blog[2], researchers explained how WMI was used to implement persistence after a system has been infected by Turla. The malware uses a WMI feature called an "event consumer" which is used to trigger a script when an event occurred[3]. WMI can monitor a system and extract a lot of information like the system uptime. The created event consumer launches a script when the update is between 300 and 400 seconds. See the ESET article for more details.
From a blue team perspective, how to detect this kind of malicious activity? Does WMI generate events on a stock Windows? By default, WMI events are logged in the following event channel:
Application & Service Logs / Microsoft / Windows / WMI-Activity / Operational
When you query the system via WMI, an event ID 5857 is created:
<Event xmlns="http://schemas.microsoft.com/win/2004/08/events/event">
  <System>
    <Provider Name="Microsoft-Windows-WMI-Activity" Guid="{1418ef04-b0b4-4623-bf7e-d74ab47bbdaa}" />
    <EventID>5857</EventID>
    <Version>0</Version>
    <Level>0</Level>
    <Task>0</Task>
    <Opcode>0</Opcode>
    <Keywords>0x4000000000000000</Keywords>
    <TimeCreated SystemTime="2019-06-06T15:43:42.614594800Z" />
    <EventRecordID>4211</EventRecordID>
    <Correlation />
    <Execution ProcessID="27808" ThreadID="27836" />
    <Channel>Microsoft-Windows-WMI-Activity/Operational</Channel>
    <Computer>WIN10ESX</Computer>
    <Security UserID="S-1-5-20" />
  </System>
  <UserData>
    <Operation_StartedOperational xmlns="http://manifests.microsoft.com/win/2006/windows/WMI">
    <ProviderName>CIMWin32a</ProviderName>
   <Code>0x0</Code>
    <HostProcess>wmiprvse.exe</HostProcess>
    <ProcessID>27808</ProcessID>
    <ProviderPath>%systemroot%\system32\wbem\wmipcima.dll</ProviderPath>
    </Operation_StartedOperational>
  </UserData>
</Event>
This is not very relevant because WMI usage can be huge and will generate some noise but it will not return the creation of a new consumer, except if the operation failed. If you want more details about the WMI activity on a system, you can use ETW or “Event Tracing for Windows”[4]. This feature of the Windows API generates specific logs called Event Trace Logs (ETL) which contain binary data. To read them, you need a specific tool like Windows Event Viewer, TraceFmt or Netmon.
To enable the event tracing of WMI, you can use the command line:
PS C:\Users\isc> wevtutil.exe sl Microsoft-Windows-WMI-Activity/Trace /e:true
Or, with the Event Viewer GUI: Select “Show Analytics and Debug Logs” in the View menu, then go to the event channel, select “Trace”, right-mouse button and select “Enable Log”.
Now, you’ll be able to see the WMI queries:
<Event xmlns="http://schemas.microsoft.com/win/2004/08/events/event">
  <System>
    <Provider Name="Microsoft-Windows-WMI-Activity" Guid="{1418ef04-b0b4-4623-bf7e-d74ab47bbdaa}" />
    <EventID>11</EventID>
    <Version>0</Version>
    <Level>4</Level>
    <Task>0</Task>
    <Opcode>0</Opcode>
    <Keywords>0x8000000000000000</Keywords>
    <TimeCreated SystemTime="2019-06-06T15:51:38.630565900Z" />
    <EventRecordID>4</EventRecordID>
    <Correlation ActivityID="{6ed7b9d6-c593-46ad-ab6d-61ee5f76b4a3}" />
    <Execution ProcessID="1828" ThreadID="25904" ProcessorID="0" KernelTime="0" UserTime="0" />
    <Channel>Microsoft-Windows-WMI-Activity/Trace</Channel>
    <Computer>WIN10ESX</Computer>
    <Security UserID="S-1-5-18" />
  </System>
  <UserData>
    <Operation_New xmlns="http://manifests.microsoft.com/win/2006/windows/WMI">
    <CorrelationId>{00000000-0000-0000-0000-000000000000}</CorrelationId>
    <GroupOperationId>60973</GroupOperationId>
    <OperationId>60974</OperationId>
    <Operation>Start IWbemServices::ExecQuery - root\SecurityCenter2 : SELECT displayName FROM AntivirusProduct</Operation>
    <ClientMachine>WIN10ESX</ClientMachine>
    <ClientMachineFQDN>WIN10ESX</ClientMachineFQDN>
    <User>WIN10ESX\isc</User>
    <ClientProcessId>27608</ClientProcessId>
    <ClientProcessCreationTime>132043098985649148</ClientProcessCreationTime>
    <NamespaceName>\\.\root\SecurityCenter2</NamespaceName>
    <IsLocal>true</IsLocal>
    </Operation_New>
  </UserData>
</Event>
Here is an example of an event consumer creation:
<Event xmlns="http://schemas.microsoft.com/win/2004/08/events/event">
  <System>
    <Provider Name="Microsoft-Windows-WMI-Activity" Guid="{1418ef04-b0b4-4623-bf7e-d74ab47bbdaa}" /
    <EventID>11</EventID>
    <Version>0</Version>
    <Level>4</Level>
    <Task>0</Task
    <Opcode>0</Opcode>
    <Keywords>0x8000000000000000</Keywords>
    <TimeCreated SystemTime="2019-06-06T19:01:22.421430100Z" />
    <EventRecordID>3</EventRecordID>
    <Correlation ActivityID="{952ac41b-cc77-40d6-9cae-8e35513ee284}" />
    <Execution ProcessID="1828" ThreadID="20680" ProcessorID="0" KernelTime="0" UserTime="0" />
    <Channel>Microsoft-Windows-WMI-Activity/Trace</Channel>
    <Computer>WIN10ESX</Computer>
    <Security UserID="S-1-5-18" /
  </System>
  <UserData>
    <Operation_New xmlns="http://manifests.microsoft.com/win/2006/windows/WMI">
    <CorrelationId>{B394F6AE-0B4E-0000-CA80-E8B34E0BD501}</CorrelationId>
    <GroupOperationId>61157</GroupOperationId>
    <OperationId>61159</OperationId>
    <Operation>Start IWbemServices::PutInstance - root\subscription : __EventFilter.Name="Test-Consumer"</Operation>
    <ClientMachine>WIN10ESX</ClientMachine>
    <ClientMachineFQDN>WIN10ESX</ClientMachineFQDN>
    <User>WIN10ESX\isc</User>
    <ClientProcessId>27816</ClientProcessId>
    <ClientProcessCreationTime>132043211668214516</ClientProcessCreationTime>
    <NamespaceName>\\.\root\subscription</NamespaceName>
    <IsLocal>true</IsLocal>
    </Operation_New>
  </UserData>
</Event>
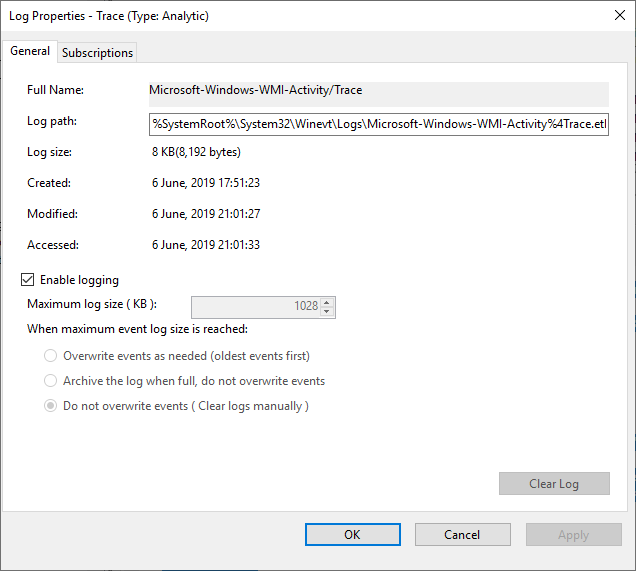
Keep in mind that ETW is a debugging feature and that extra logs can generate a lot of noise and will also stop collecting data after they reached their default limit. As you can see, the limit of events is low and, once the limit reached, the collection process stops:

More information about WMI tracing is available here[5].
[1] https://docs.microsoft.com/en-us/windows/desktop/wmisdk/wmi-start-page
[2] https://www.welivesecurity.com/2019/05/29/turla-powershell-usage/
[3] https://docs.microsoft.com/en-us/windows/desktop/wmisdk/receiving-events-at-all-times
[4] https://docs.microsoft.com/en-us/windows/desktop/etw/event-tracing-portal
[5] https://docs.microsoft.com/en-us/windows/desktop/wmisdk/tracing-wmi-activity
Xavier Mertens (@xme)
Senior ISC Handler - Freelance Cyber Security Consultant
PGP Key


Comments