SpectX: Log Parser for DFIR
I hope this finds you all safe, healthy, and sheltered to the best of your ability.
In February I received a DM via Twitter from Liisa at SpectX regarding my interest in checking out SpectX. Never one to shy away from a tool review offer, I accepted. SpectX, available in a free, community desktop version, is a log parser and query engine that enables you to investigate incidents via log files from multiple sources such as log servers, AWS, Azure, Google Storage, Hadoop, ELK and SQL-databases. Actions include:
- Large-scale log review
- Root cause analysis (RCA) during incidents
- Historical log analysis
- Virtual SQL joins across multiple sources of raw data
- Ad hoc queries on data dumps
SpectX architecture differs from other log analyzers in that it queries raw data without indexing directly from storage. SpectX runs on Windows, Linux or OSX, in the cloud, or an offline on-prem server.
The Desktop (community) version is limited to four cores max, and 300 queries a day via the SpectX API. That said, this is more than enough juice to get a lot of work done. The team, in Tallinn, Estonia, including Liisa and Raido, has been deeply engaging and helpful offering lots of insight and use case examples that I’ll share here.
Installation is really straightforward. This is definitely a chance to RTFM as the documentation is extensive and effective. I’ll assume you’ve read through Getting Started and Input Data as I walk you through my example.
Important: You’ll definitely want to setup GeoIP, ASN, and MAC lookup capabilities. Don’t try to edit the conf file manually, use Configure from the SpectX management console to enter your MaxMind key.
While SpectX is by no means limited to security investigation scenarios, that is, of course, a core tenet of HolisticInfoSec, so we’ll focus accordingly.
SpectX is really effective at querying remote datastores, however, I worked specifically with local logs for the entirety of 2019 for holisticinfosec.io.
Wildcards are your friend. To query all twelve files in my Logs directory, it’s as easy as
LIST('file:/C:/logs/holisticinfosec.io-ssl_log-*')
| parse(pattern:"LD:line (EOL|EOF)")
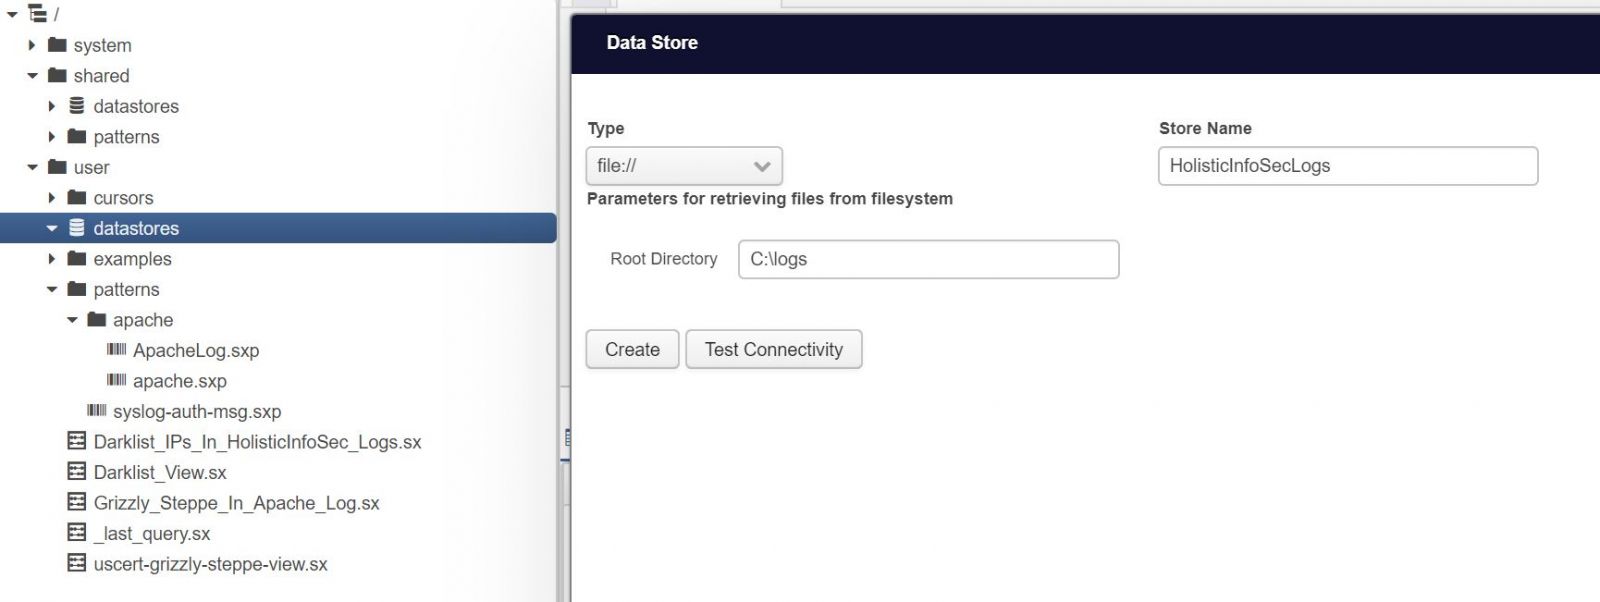
Again, note the file protocol, you can call logs from so many sources, as referred to in Input Data. You can also create a local datastore that contains all the related log files, I do so as seen in Figure 1.
Figure 1: HolisticInfoSec Logs Datastore
You will assuredly want to familiarize yourself with pattern development, the Pattern Development Guide is there to help you. I built a simple pattern to parse my logs for 2019 as follows
IPV4:clientIp LD HTTPDATE:timestamp LD:text EOL;
and saved it as apacheLog.sxp in user/patterns/apache. You can save patterns and queries to the default SpectX home directory. On a Windows system the default path is pretty brutal, mine is C:\Users\rmcree\AppData\Local\SpectX\SpectXDesktop\data\user\rmcree. Save there, and files are readily available in the menu tree under user. Again, I chose to store all my patterns and queries in subdirectories of my C:\logs directory as called by the HolisticInfoSecLogs datastore referred to above, resulting in much file path ease of use with a simple datastore call.
I initially followed the first example provided in Analyzing Activity From Blocklisted IP addresses and TOR Exit Nodes, and received a couple of hits against my logs but wanted to experiment further. While this is a good example, and you should play with it to become accustomed with SpectX, the case study is dated as the US Cert Grizzly Steppe advisory and provided CSV data are circa 2016. IP addresses are a questionable indicator even in real-time, definitely not from three and a half years ago. As such I chose to call real-time data from Darklist.de, an IP blocklist that uses multiple sensors to identify network attacks and spam incidents. They provide a raw IP list for which I built a view as follows
// Parse simple pattern of Darklist.de raw IP format:
$srcp = <<<PATTERN_END
LD*:indicatorValue
EOL
PATTERN_END;

$hostPattern = <<<PATTERN_END
(IPV4:clientIpv4 | [! \n]+:host)
EOS
PATTERN_END;

// function to handle any oddly formatted IP addresses, uses $hostPattern above
$getHost(iVal) = PARSE($hostPattern, REPLACE($iVal, '[.]', '.') );

// execute main query:
PARSE(pattern:$srcp, src:'https://darklist.de/raw.php')
| select($getHost(indicatorValue) as hostVal)
| select(hostVal[clientIpv4] as ipv4)
| filter(ipv4 is not null)
;
and saved it as Darklist_View.sx. This view is then incorporated into a query that cross-references all twelve of my monthly logs with the real-time raw IP blocklist from Darklist, then match only records with blocklist IP addresses in those logs.
Quick note to reputation list providers here, in the spirit of a more inclusive nomenclature, please consider allowlist and blocklist as opposed to whitelist and blocklist. Thank you.
The resulting query follows
@access_logs = PARSE(pattern:FETCH('file://HolisticInfoSecLogs/patterns/ApacheLog.sxp'),
                src:'file://HolisticInfoSecLogs/holisticinfosec.io-*');

// get IPv4 addresses recommended for traffic reviewing from US-CERT bad ip list:
@suspect_list = @[Darklist_View.sx]
//| filter(type = 'IPV4ADDR')
| select(ipv4);

// execute main query:
@access_logs
| filter(clientIp IN (@suspect_list))     // we're interested only in records with suspect IP addresses

| select(timestamp,                         // select relevant fields
      clientIp,
      CC(clientIp), ASN_NAME(clientIp), GEOPOINT(clientIp),  // enrich data with geoip, ASN, and geopoint lat/long for map visualization
      text);
A quick walkthrough of the three query phases.
First, the directory of logs is parsed using the principles defined in the Apache log pattern established earlier, and assigned to the @access_logs parameter.
Second, the real-time view of Darklist’s raw IP blocklist is parameterized in @suspect_list.
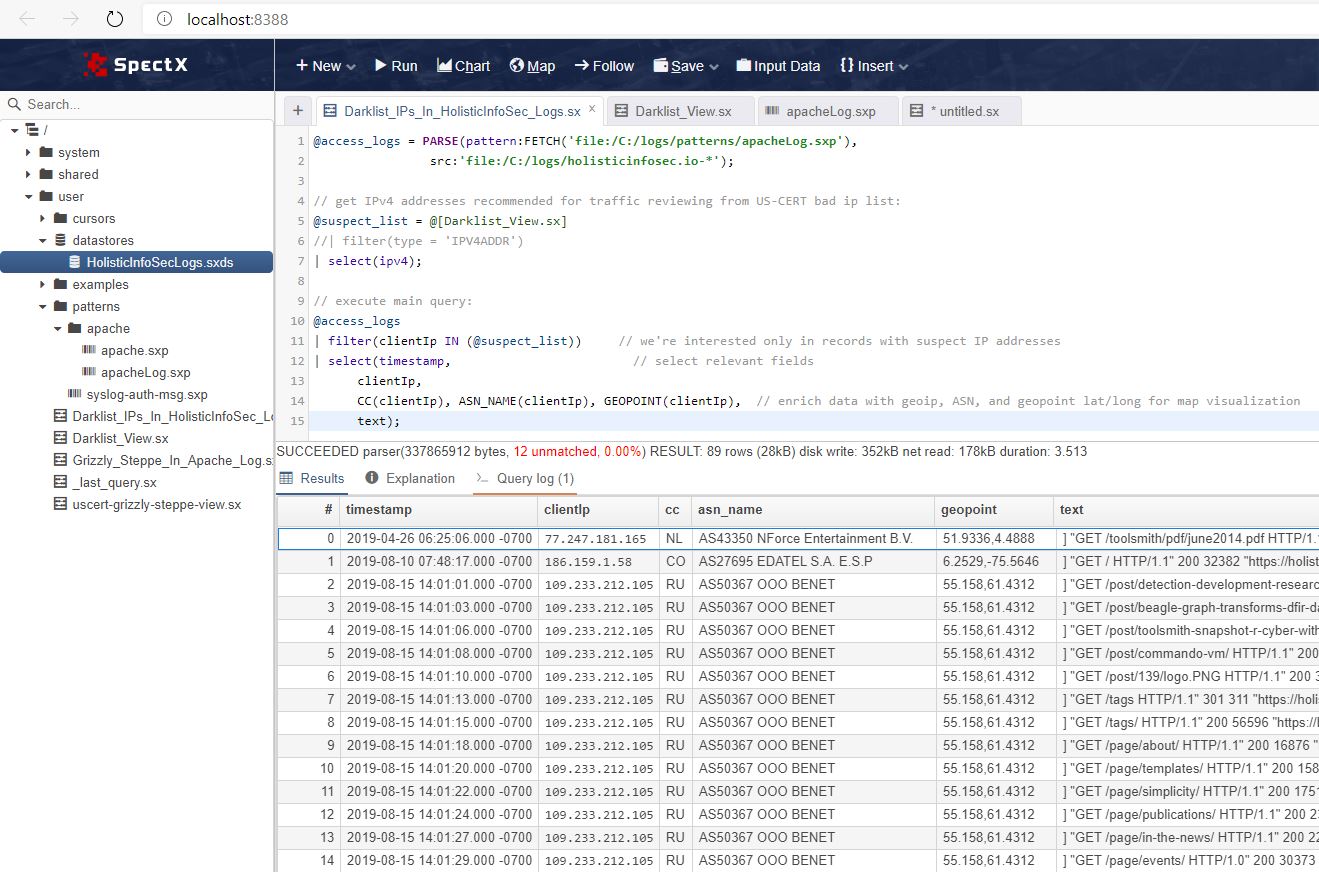
Third, access_logs is filtered to return only log entries for my website with entries from blocklisted IPs using the IN Boolean operator, and enriched with MaxMind data. The result is seen in Figure 2.
Figure 2: Darklist blocklist results
For a free desktop client built on Java, I have to say, I’m pretty impressed. Query times are quite snappy under those otherwise adverse operating conditions. ;-) My simple query to parse the entire year of logs for my website (not high traffic) returned 1,605,666 rows in 1.575 seconds. Matching all those rows against the real-time Darklist blocklist took only 3.513 seconds as seen in Figure 2. Also, hello Russia!
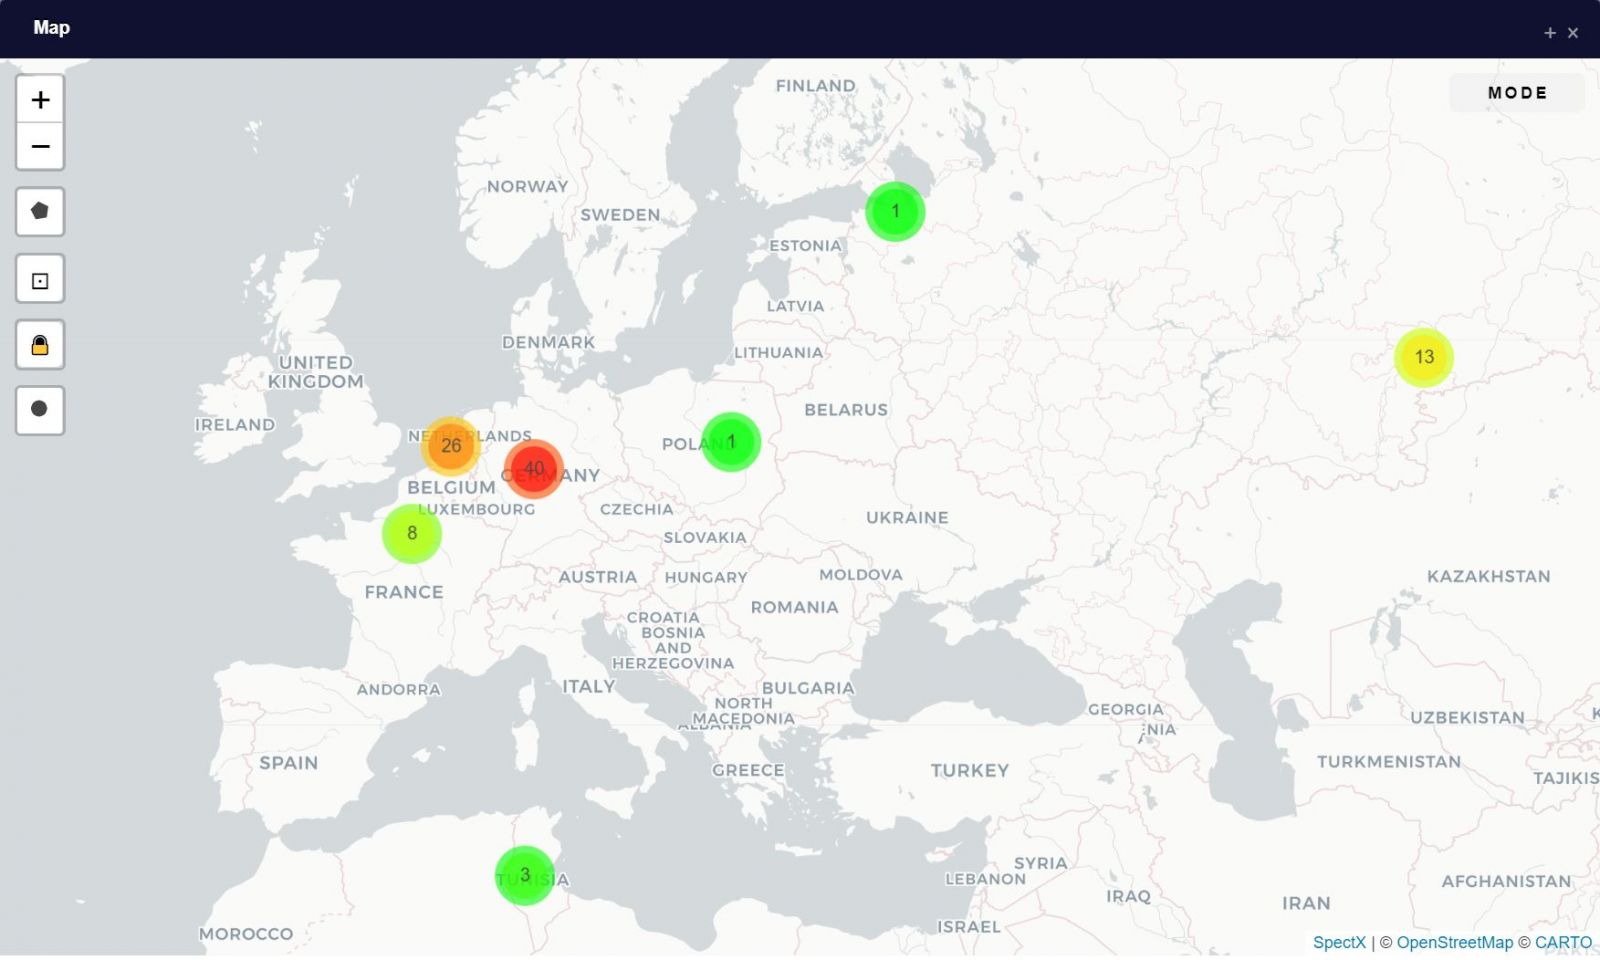
I also added some extra gravy here in the last phase, specifically GEOPOINT(clientIp). This exposes the Map feature in the Web UI. As the datascientists who work on my team will testify, I bug them mercilessly to visualize their results and output. SpectX makes it extremely easy to do so with the Chart and Map features. If your query includes the appropriate calls to trigger the features, you’ll see Chart and/or Map, SpectX searches for a certain type of column(s) that can be visualized. The Map feature requires GEOPOINT. The result on my dataset presents us with a hotspot view to the blocklisted culprits traversing my site, as seen in Figure 3.
Figure 3: Clustermap of blocklist traffic origins
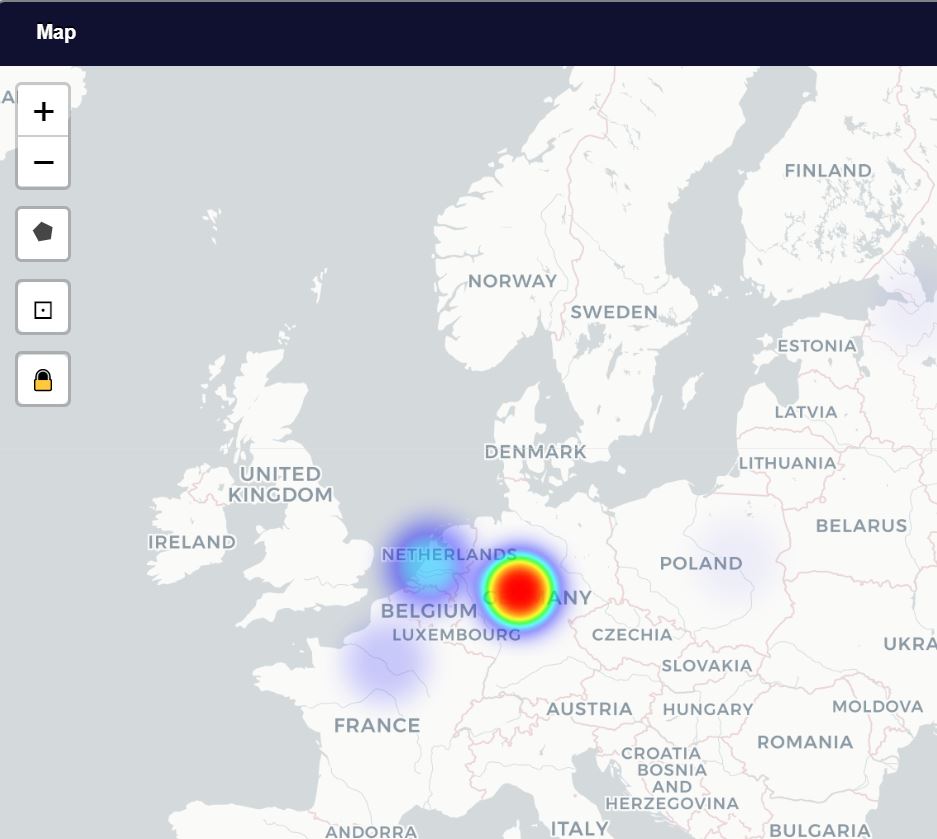
Two modes are available in the Map: Cluster and Heatmap. You see a cluster map in Figure 3. The most blocklist traffic originates from AS60729 in Germany. This is furher illuminated courtesy of the heatmap view, as seen in Figure 4.
Figure 4: Heatmap of blocklist traffic origins
I’ve posted my queries and pattern, in a GitHub repo (SpectX4DFIR) so you may follow along at home. The logs are stored for you on my OneDrive. Read as much of the SpectX documentation as you can consume, then experiment at will. Let me know how it goes, I’d love to hear from you regarding successful DFIR analyses and hunts with SpectX.
This is another case of a tip-of-the-iceberg review, there is a LOT of horsepower in this unassuming desktop client version of SpectX. Thanks to the SpectX team for reaching out, and for building what appears to be a really solid log parser and query engine.
Cheers…until next time.


Comments