DShield Sensor JSON Log to Elasticsearch
My current project has been to rebuild my home DShield sensor from a Rasberry Pi to a Ubuntu 20.04.5 LTS server to be able to process my sensor logs into Elasticsearh. I use as a guide the example listed here (my ELK is version 8.x) sending the cowrie.json logs to a remote ELK server (version 8.4.1) using Filebeat and Logstash. However, my steps were a little different than the reference:
1 - Install the OS (basic server version)
2 - Add the following packages
$ sudo apt-get install net-tools open-vm-tools htop ntp bind9-utils vim network-manager
$ sudo systemctl start NetworkManager
$ sudo systemctl enable NetworkManager
$ sudo nmcli device show
Configure sensor static IP [2]
$ sudo vi /etc/netplan/00-installer-config.yaml
3 - Install DShield sensor using the steps and script shared in Github
4 - Install and configure filebeat
$ wget -qO - https://artifacts.elastic.co/GPG-KEY-elasticsearch | sudo apt-key add -
$ echo "deb https://artifacts.elastic.co/packages/8.x/apt stable main" | sudo tee -a /etc/apt/sources.list.d/elastic-8.x.list
$ sudo apt-get update && sudo apt-get install filebeat
→ Edit and configure the filebeat.yml with the following setting to send the logs to Elasticsearch
$ sudo vi or nano /etc/filebeat/filebeat.yml
filebeat.inputs:
- type: log
json.keys_under_root: true
json.add_error_key: true
json.message_key: log
# Unique ID among all inputs, an ID is required.
id: cowrie
# Change to true to enable this input configuration.
enabled: true
# Paths that should be crawled and fetched. Glob based paths.
paths:
- /srv/cowrie/var/log/cowrie/cowrie.json*
output.logstash:
hosts: ["192.168.xx.xx:5044"]
$ sudo systemctl start filebeat
$ sudo systemctl status filebeat
$ sudo systemctl enable filebeat
5 - Import the Cowrie mapping template into Elasticsearch via Dev Tools.
6 - Copy and configure Logstash parser (i.e. ELK destination, certificates, etc)
I have shared the Kibana Cowrie mapping template here and logstash parser here.
$ sudo systemctl restart logstash
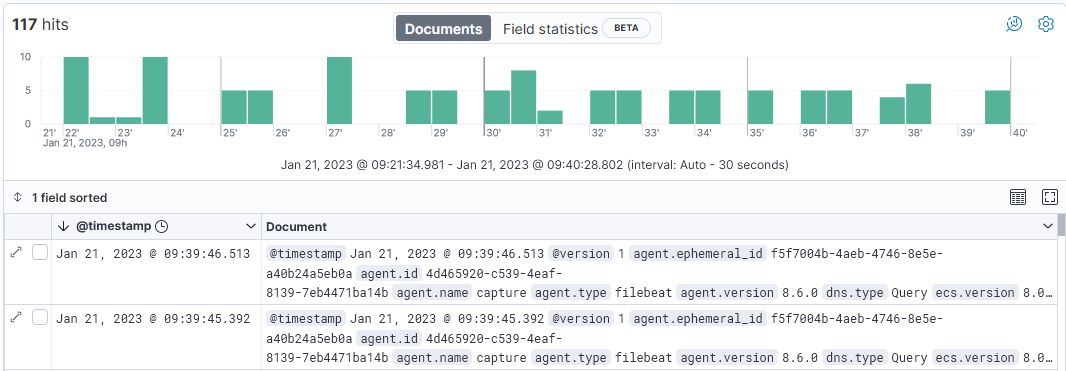
After a logstash service restart, monitor the service to ensure there are no errors and a file like this, cowrie-2023.01.21-000001 should be visible in the Index Management in Kibana. The shared dashboard available here to be imported in Kibana in the shared object (version => 8.4.1).
Kibana Cowrie logs
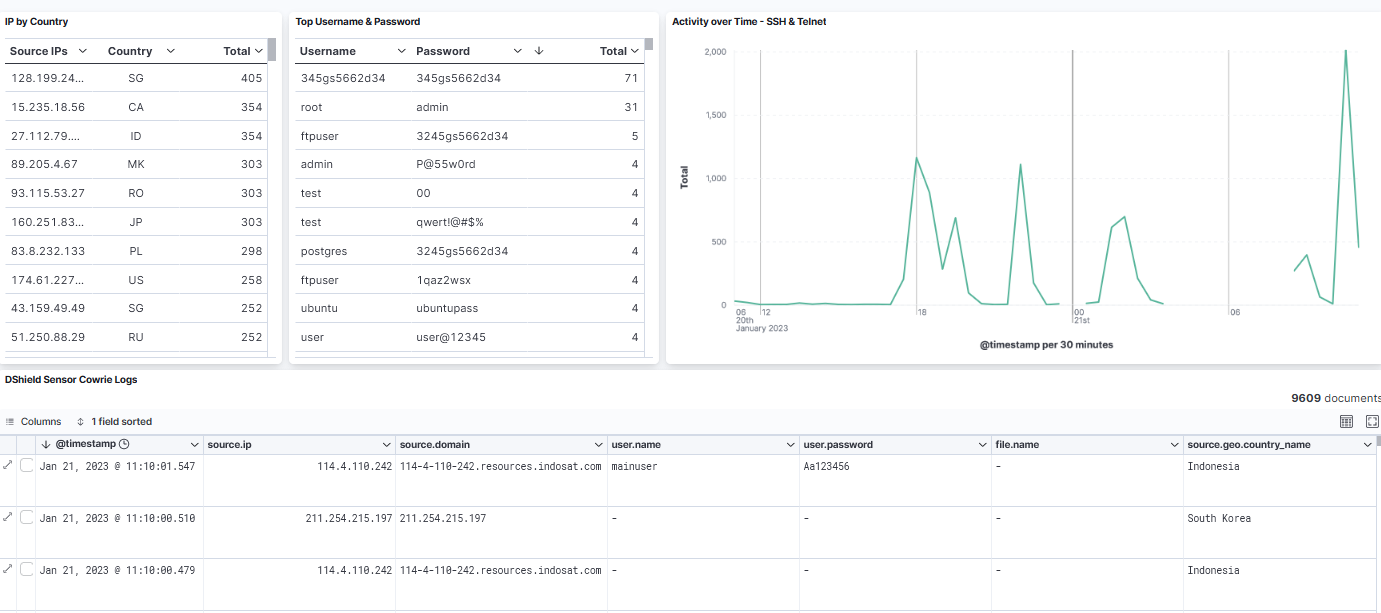
Kibana Dashboard
The activity shown in this dashboard should be the same as the logs the sensor is reporting to DShield. Now this information is available to compare against threatintel.
DShield Sensor Log Location
Log files: /srv/cowrie/var/log/cowrie/
Uploaded files: /srv/cowrie/var/lib/cowrie/downloads
Firewall logs: /var/log/dshield.log
Weblogs: /srv/www/DB/swebserver.sqlite
[1] https://cowrie.readthedocs.io/en/latest/elk/README.html
[2] https://www.serverlab.ca/tutorials/linux/administration-linux/how-to-configure-networking-in-ubuntu-20-04-with-netplan/
[3] https://isc.sans.edu/tools/honeypot/
[4] https://isc.sans.edu/diary/29412
[5] https://isc.sans.edu/diary/29370
[6] https://isc.sans.edu/diary/28872
[7] https://handlers.sans.edu/gbruneau/elk/logstash-filter-cowrie.conf
[8] https://handlers.sans.edu/gbruneau/elk/cowrie_8.4.1.ndjson
[9] https://handlers.sans.edu/gbruneau/elk/cowrie-mapping-template.txt
-----------
Guy Bruneau IPSS Inc.
My Handler Page
Twitter: GuyBruneau
gbruneau at isc dot sans dot edu


Comments