Tor Use Uptick
The Tor Metrics Portal is reporting a jump in their user metrics (https://metrics.torproject.org/users.html)
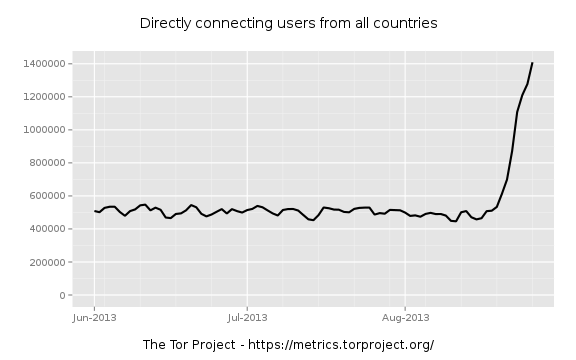
This is causing a bit of discussion and as people share observations and data with each other a few hypotheses bubble up.
- It's a new malware variant.
- It's people responding to news of government surveillance.
- It's a reporting error.
We've received a few reports here about vulnerability scans coming in from Tor nodes, and a report of a compromised set of machines that had tor clients installed on them. As more data are shared and samples come to the surface, let's look at the Tor Project's own data a little more closely.
First, what are they actually counting? According to their site:
"After being connected to the Tor network, users need to refresh their list of running relays on a regular basis. They send their requests to one out of a few hundred directory mirrors to save bandwidth of the directory authorities. The following graphs show an estimate of recurring Tor users based on the requests seen by a few dozen directory mirrors."
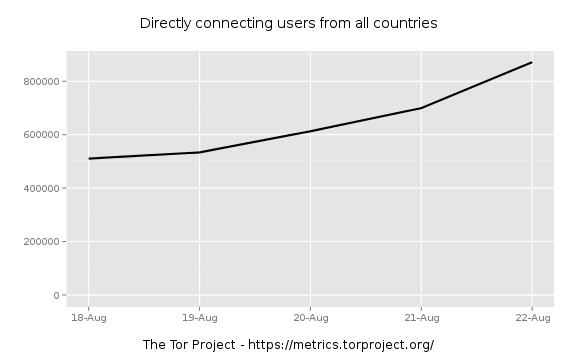
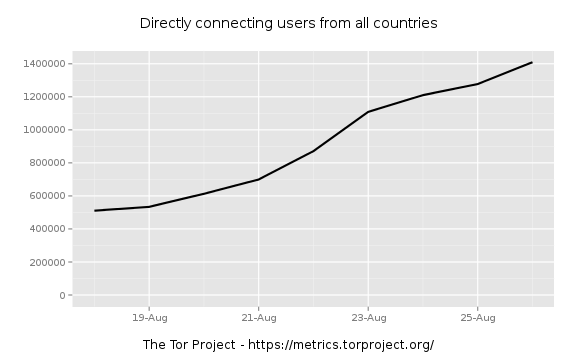
So we're seeing an uptick in directory requests. When did this start? Looks mid August, so let's zoom in and see. I try a little binary search to narrow it down. First zooming to AUG-15 through AUG-30:
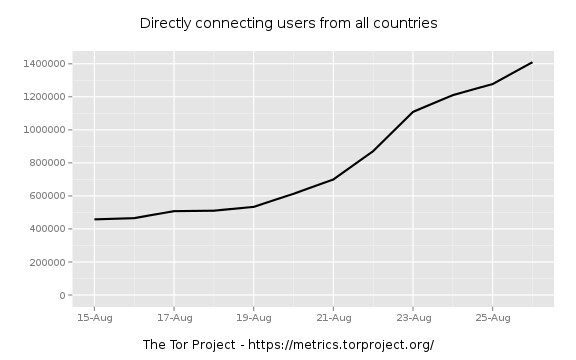
Zooming in further to find were the jump really starts:
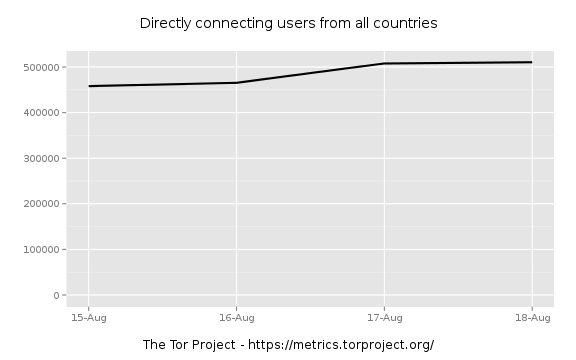
Things are still flat on the 19th.
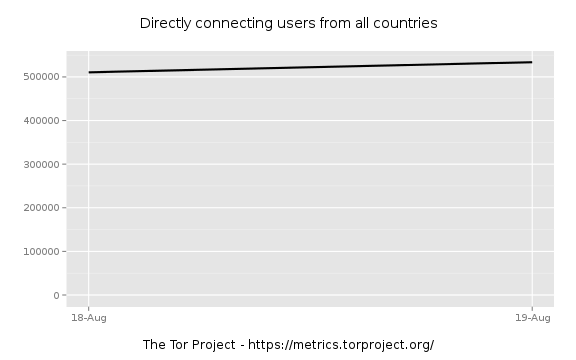
I'm liking the 19th as the beginning.
Has this happened before? Let's really widen the scope a bit.
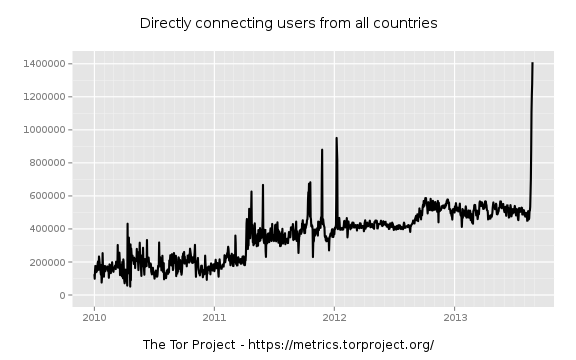
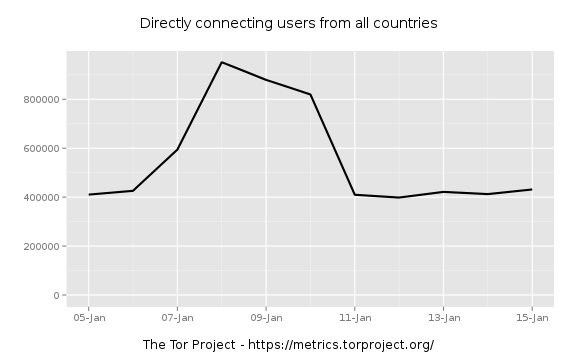
So we had a recent spike in early 2012.
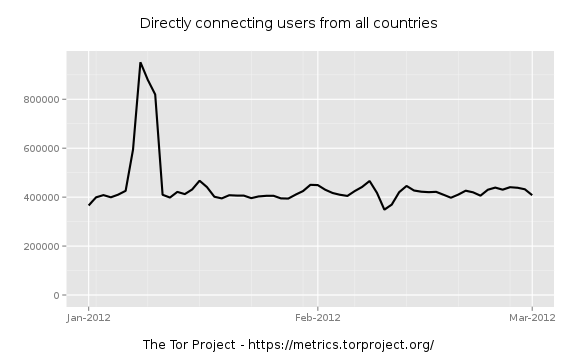
There appears to be a similar doubling of users between 06-JAN and 11-JAN in 2012
Are you seeing an uptick in TOR activity in your networks? Share you observations, and especially any malware (https://isc.sans.edu/contact.html)
Filtering Signal From Noise (Part2)
Two weeks ago I rambled a bit about trying to dig a signal out of the noise of SSH scans reported in to Dshield (https://isc.sans.edu/diary/Filtering+Signal+From+Noise/16385). I tried to build a simple model to predict the next 14-days worth of SSH scans and promised that we'd check back in to see how wrong I was.
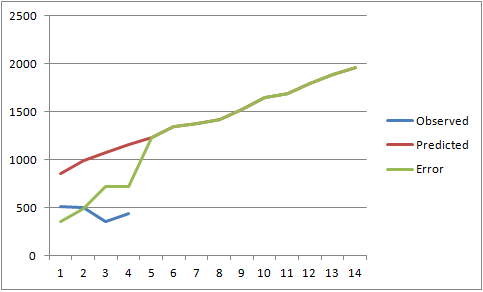
Looks like I was pretty wrong.
I have built and trained the model to do a tolerable job of describing past performance and wondered if we let it run if it'd do any better at predicting future behavior than simply taking the recent average and projecting that out linearly. I fed the numbers into the black box and click "publish" on the article before I really took a close look at what it was spitting out. There was a spike in the 48-hours between turing the model and publishing and it's imapct on the trend was a bit.. severe.
The Results
None of the approaches did an amazing job at predicting the total number of 6423, although it's amazing at how badly the Exponential model did. I have had really good results using that method with other data. I encourage you to give it a try on other problems.
| Method | SSH scan source total for 14-days | Error (%) |
| Exponential Smoothing | 19963 | 13540 (210%) |
| 7-day average projection | 7197 | 774 (12%) |
| 30-day average projection | 7054 | 631 (10%) |
| MCMC estimate | 5390 | 1033 (16%) |

VMware ESXi and ESX address an NFC Protocol Unhandled Exception
VMware recently released Security Advisorty VMSA-2013-0011 addressing an NFC protocol vulnerability affecting ESXi and EXI (CVE-2013-1661.) Details are available at https://www.vmware.com/support/support-resources/advisories/VMSA-2013-0011.html
The NFC (Near Field Communication) Protocol is used in tap-to-pay cards and sharing contacts between mobile devices. This vulnerability exposes the hypervisor to a denial-of-service.
UPDATE: NFC in this case refers to Network File Copy. Which makes a lot more sense, I was wondering how you'd tap two VMs together. Thank you sine nomine.


Comments