Filtering Signal From Noise
We have used the term "internet background radiation" more than once to describe things like SSH scans. Like cosmic background radiation, it's easy to consider it noise, but one can find signals buried within it, with enough time and filtering. I wanted to take a look at our SSH scan data and see if we couldn't tease out anything useful or interesting.
First Visualization
I used the DShield API to pull this year's port 22 data (https://isc.sans.edu/api/ for more details on our API.) Graphing out the targets and sources we see something, but it's not obvious what we're looking at.
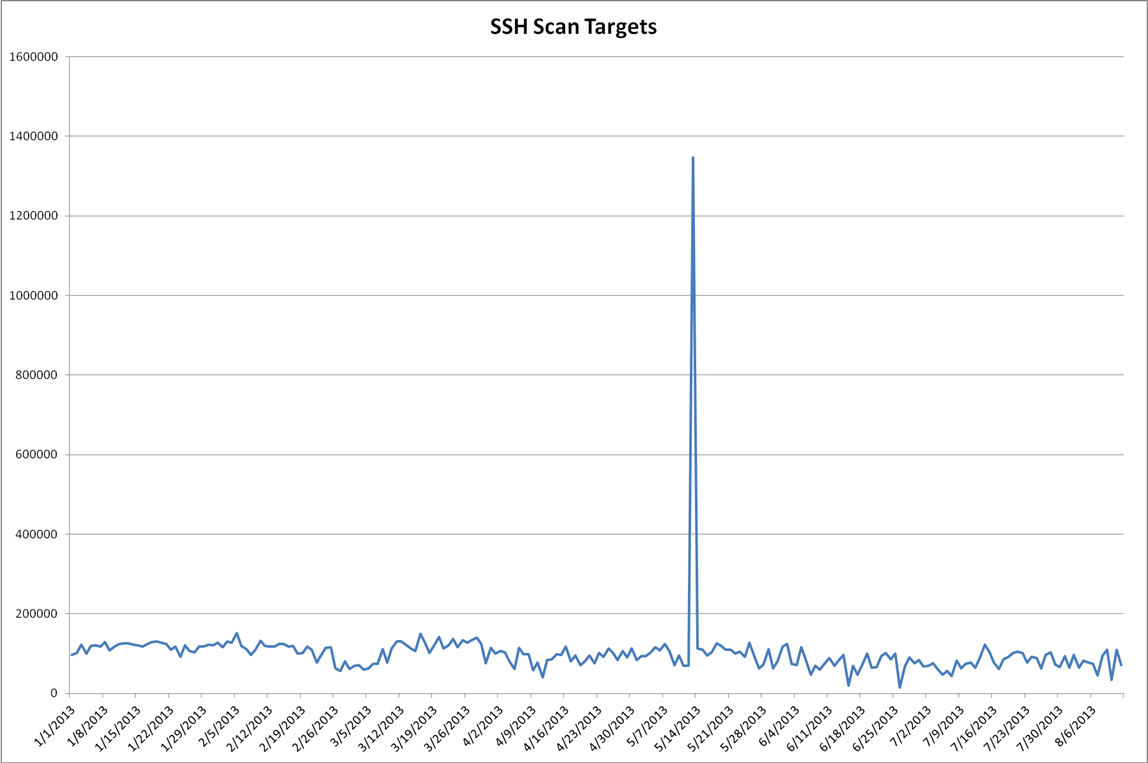
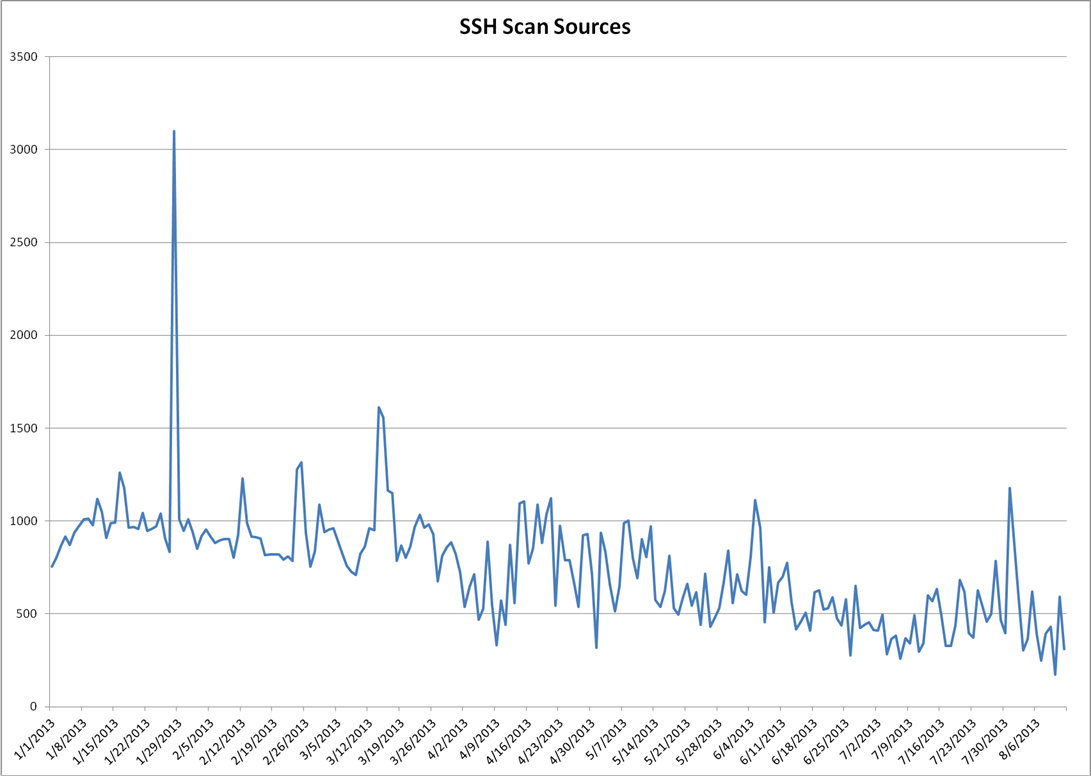
Looking at the plot of targets over time, you can see how the description of "background radiation" applies. The plot of sources looks more interesting. It's the plot of the number of IPs seen scanning the internet on a given day. It's likely influenced by the following forces:
- Bad Guys compromising new boxes for scanning
- Good Guys cleaning up systems
- Environmental effects like backhoes and hurricanes isolating DShield sensors or scanning systems from the Internet.
Looking for Trends
One way to try and pull a signal out of what appears to be noise is to filter out the higher frequencies, or smooth plot out a bit. I'm using a technique called exponential smoothing. I briefly wrote about this last year and using it for monitoring your logs (https://isc.sans.edu/diary/Monitoring+your+Log+Monitoring+Process/12070) The specific technique I use is described in Philipp Janert's "Data Analysis with Open Source Tools" pp86-89. (http://shop.oreilly.com/product/9780596802363.do)
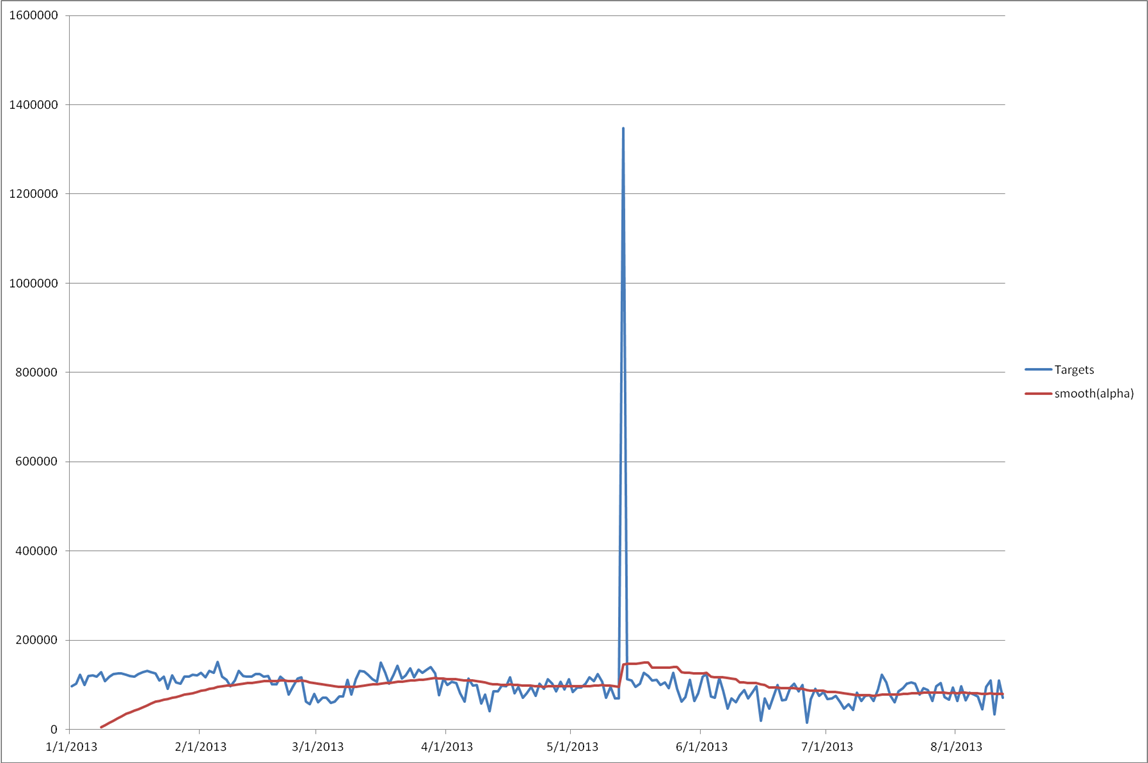
Most of the models I've been recently making have a human, or business cycle to them and they're built longer-term aggregate predictions. So I've been weighing them heavily towards historical behavior and using a period of 7 days so that I'm comparing Sundays to Sundays, and Wednesdays to Wednesdays. You can see how the filter slowly ramps up, taking nearly two months' of samples before converging on the observed data points. Also the spike on May 13, 2013 shows how this method can be sensitive outliers.
One of my assumptions in the model is that there's a weekly cycle hidden in there, which implies human-influence on the number of targets per day. Given that we're dealing with automated processes running on computers, this assumption might not be such a good idea.
Autocorrelation
If a time-series has periodicity, it will show up when you look for autocorrelation (http://en.wikipedia.org/wiki/Autocorrelation) For example, I used R (http://www.r-project.org/) to autocorrelate a sample of a known human-influenced process, the number of reported incidents a day.
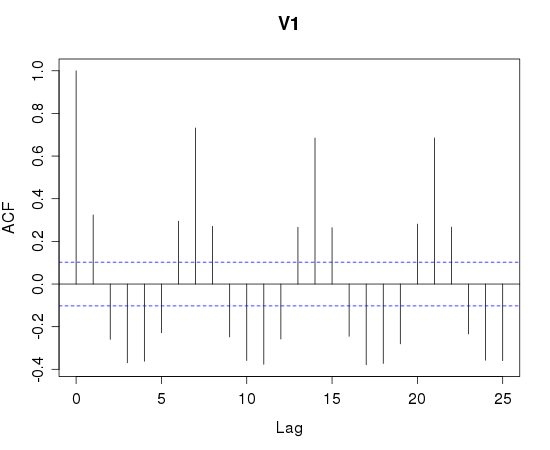
Note the spikes on lag 7,14,21. This is a strong indicator that a 7 day period is present. Looking at the SSH scan data for autocorrelation looks less useful:
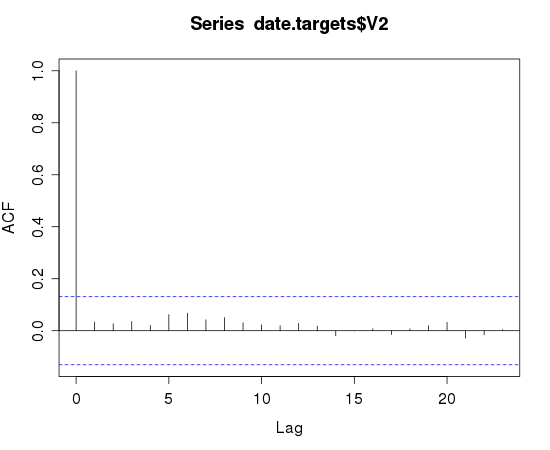
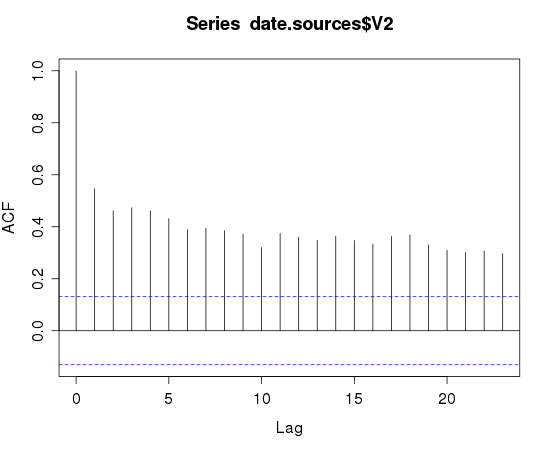
The target plot reinforces the classification of background noise. The sources plot indicates a higher degree of self-similarity than I would expect. You'd have to squint really hard and disbelieve some of the results to see the 7-day periodicity that I had in my initial assumption.
Markov Chain Monte Carlo Bayesian Methods
When I was reading through "Probabilistic Programming and Bayesian Methods for Hackers" (https://github.com/CamDavidsonPilon/Probabilistic-Programming-and-Bayesian-Methods-for-Hackers) I was very impressed by the first example and have been using that on my own data. Having a tool that can answer the question "has there been a change in the behavior of this ____ and if so, what kind of change, and when did it happen?"
This technique will work when you're dealing with a phenomena that can be described with a Poisson distribution (http://en.wikipedia.org/wiki/Poisson_distribution). Both the number of SSH-scan sources and the number of targets appear to satisfy the requirements.
So, has there been a change in the number of targets or sources in the past 30 days?
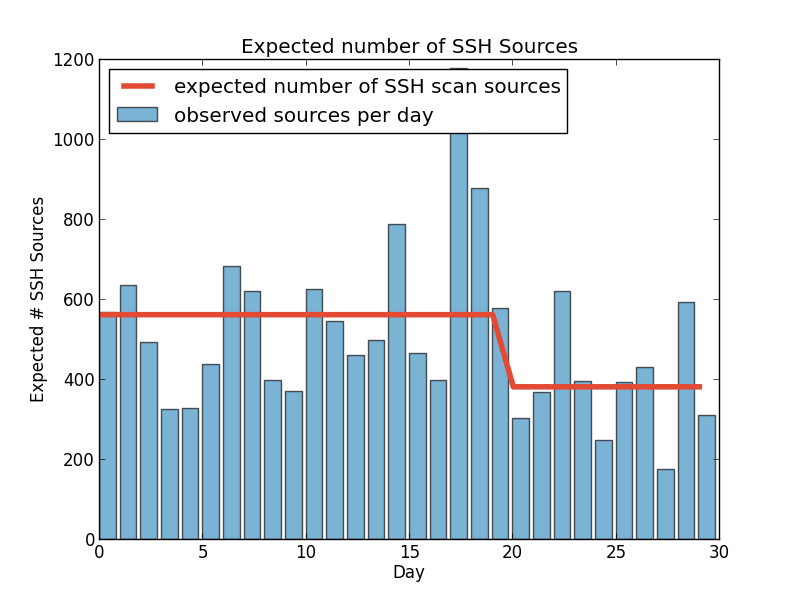
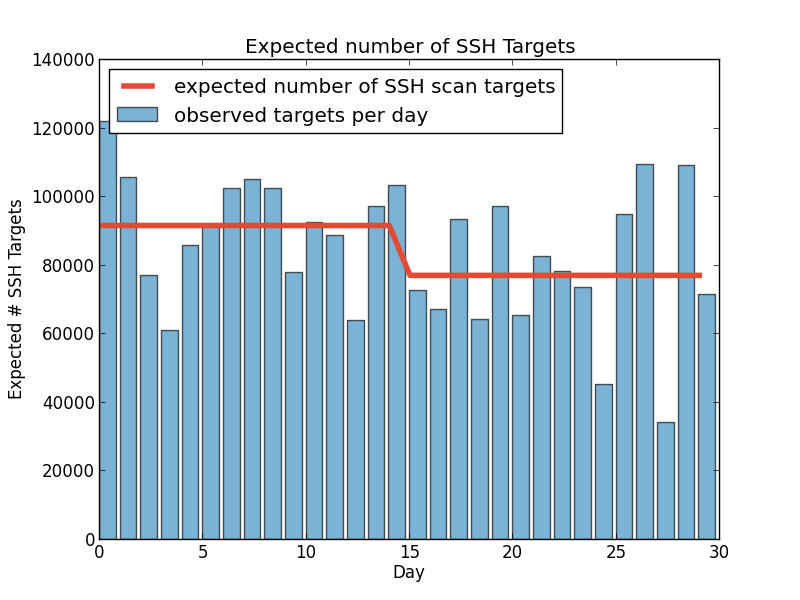
These plots show that according to multiple MCMC models the average number of SSH scan sources seen by DShield sensors per day dropped from a little under 600 to 400 per day. Scan targets sees a similar drop 15 days ago (these were executed August 12th.) An added benefit of any Bayesian method is that the answers are probability distributions so the confidence is built into the answer.
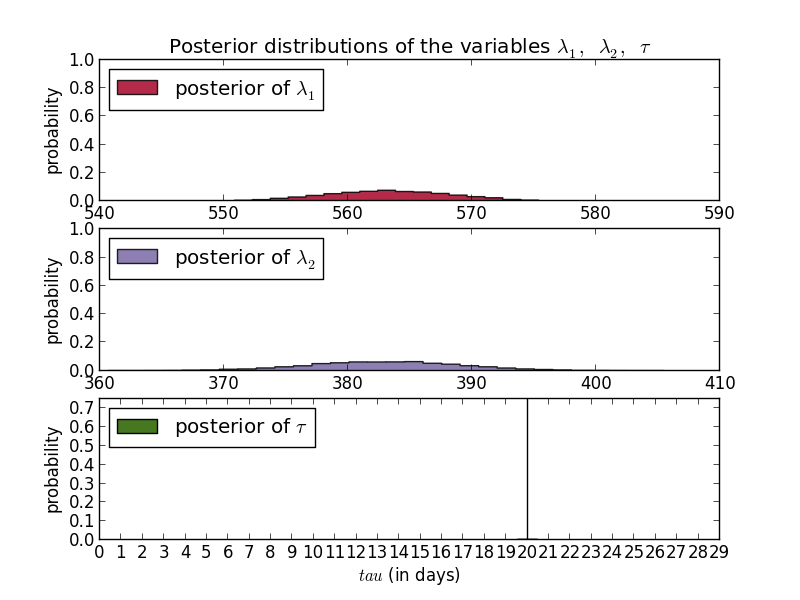
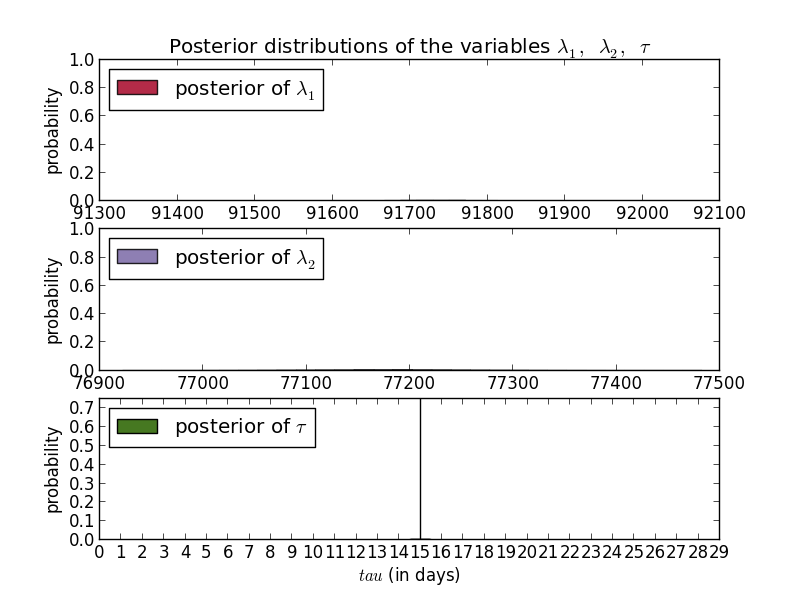
In these cases, the day of the change is fairly certain while the exact values are less so. For sources you can see that the most common results were around 563 and 383. For targets, you have to look really hard to see any curve and are left with the ranges, e.g. between 77000 and 77400 for the new average.
What this doesn't tell us is what was the cause of the change. This method is useful for detecting the change, and if you're trying to measure the impact of known changes. For example, if we were aware of a new effort to clean up a major botnet, or were trying to identify when a new botnet started scanning, this process may be valuable.
Predictions
While the MCMC method allows us to analyze back, the exponential smoothing method allows us to synthesize forward. So for fun, I'll predict that the total number of sources scanning TCP/22 between August 16 and August 29 will be 19963 +/- 1%
We can also use the output of the MCMC model to extrapolate a similar projection. Using a 7-day and a 30-day observations to calculate our averages they project the following.
| Method | SSH scan source total for 14-days |
|---|---|
| Exponential Smoothing | 19963 |
| 7-day average projection | 7197 |
| 30-day average projection | 7054 |
Check back in two weeks to see how wildly incorrect I am.
-KL


Comments
Anonymous
Aug 16th 2013
1 decade ago
Anonymous
Aug 17th 2013
1 decade ago
Anonymous
Aug 17th 2013
1 decade ago
Anonymous
Aug 21st 2013
1 decade ago