DShield for Splunk
As I’ve been working quite a bit with Splunk lately I decided to create a DShield for Splunk application that is now publicly available at Splunk base: http://splunk-base.splunk.com/apps/51609/splunk-for-dshield
The idea behind the application is to allow you to have you own, local copy of the DShield database so you can mine data as much as you want.
The application downloads the DShield data (the published All Sources IPs dump) once per day and indexes it into your local Splunk. Once the data has been indexed you can do all sorts of analytics and show top attackers, top attacked ports, their geographical information and much more.
The configuration allows you to specify when you want to download the DShield data (since it’s dumped once per day at 4 AM UTC you should also mirror the data once per day). You can also specify your own IP addresses or networks so the application will nicely list if your IPs have been detected in the attackers list (and, of course, you can change this into an alert).
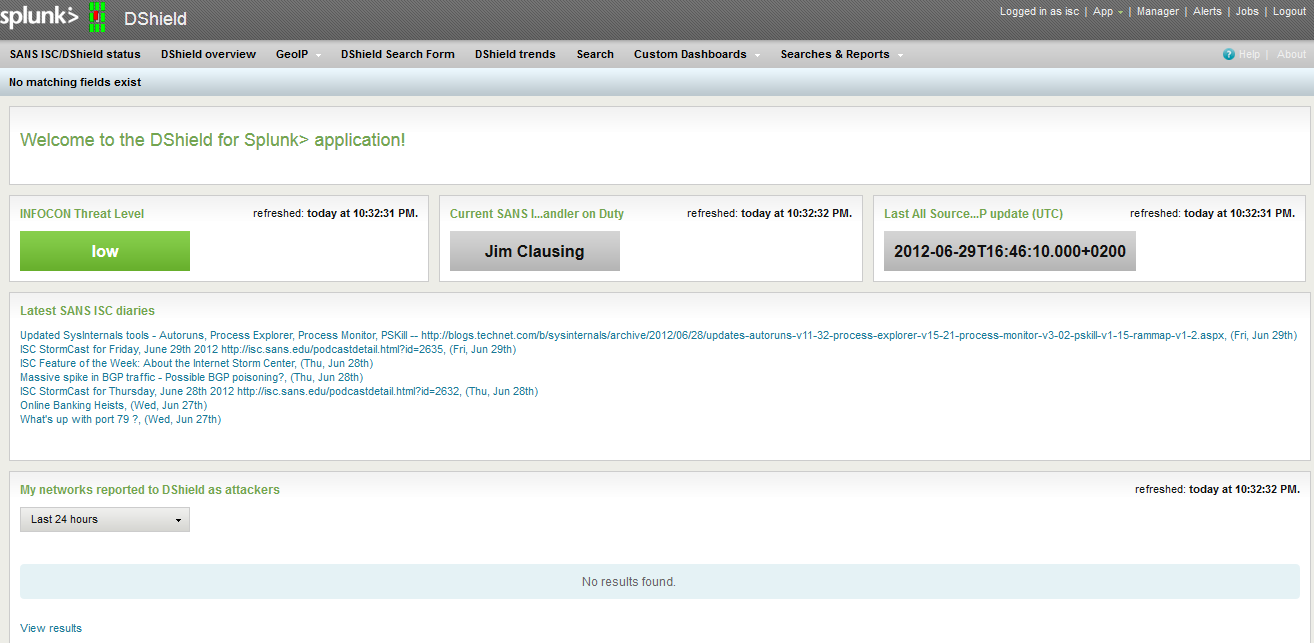
This is shown in the main dashboard, besides the current Handler on Duty and Threatcon (which are retrieved in real time when you open the dashboard), as well as a panel showing last 10 ISC diaries (so you can jump to them from your local Splunk). The main dashboard is shown below:

Besides this, the application has the following dashboards:
* a dashboard showing top attackers, top attacked ports and protocols
* a dashboard showing Geo IP information about attackers, both in a table and using Google maps
* a search form that allows quick searching by IP address (or CIDR ranges), port or protocol
* a trend dashboard showing number of distinct IP addresses as well as total number of reports DShield received
I hope you will find it useful – if you have any questions or suggestions for improvement please let me know. Also, since Splunk has a free version that allows you to index up to 500 MB of data per day, you can use this for free.
--
Bojan
INFIGO IS


Comments