nmap Service Fingerprint
Besides determining the state a TCP/UDP port, nmap can also try to figure out which service is listening on that port. This is done by sending different requests to the port, and analyzing the replies. This feature is called service detection, and is activated with option -sV.
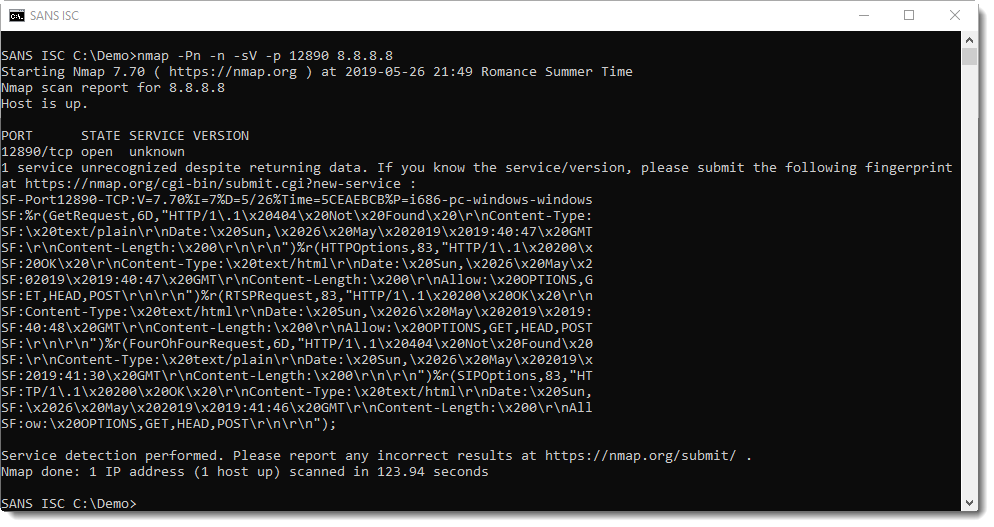
When nmap can not determine which service is listening, it will produce a so-called Service Fingerprint:

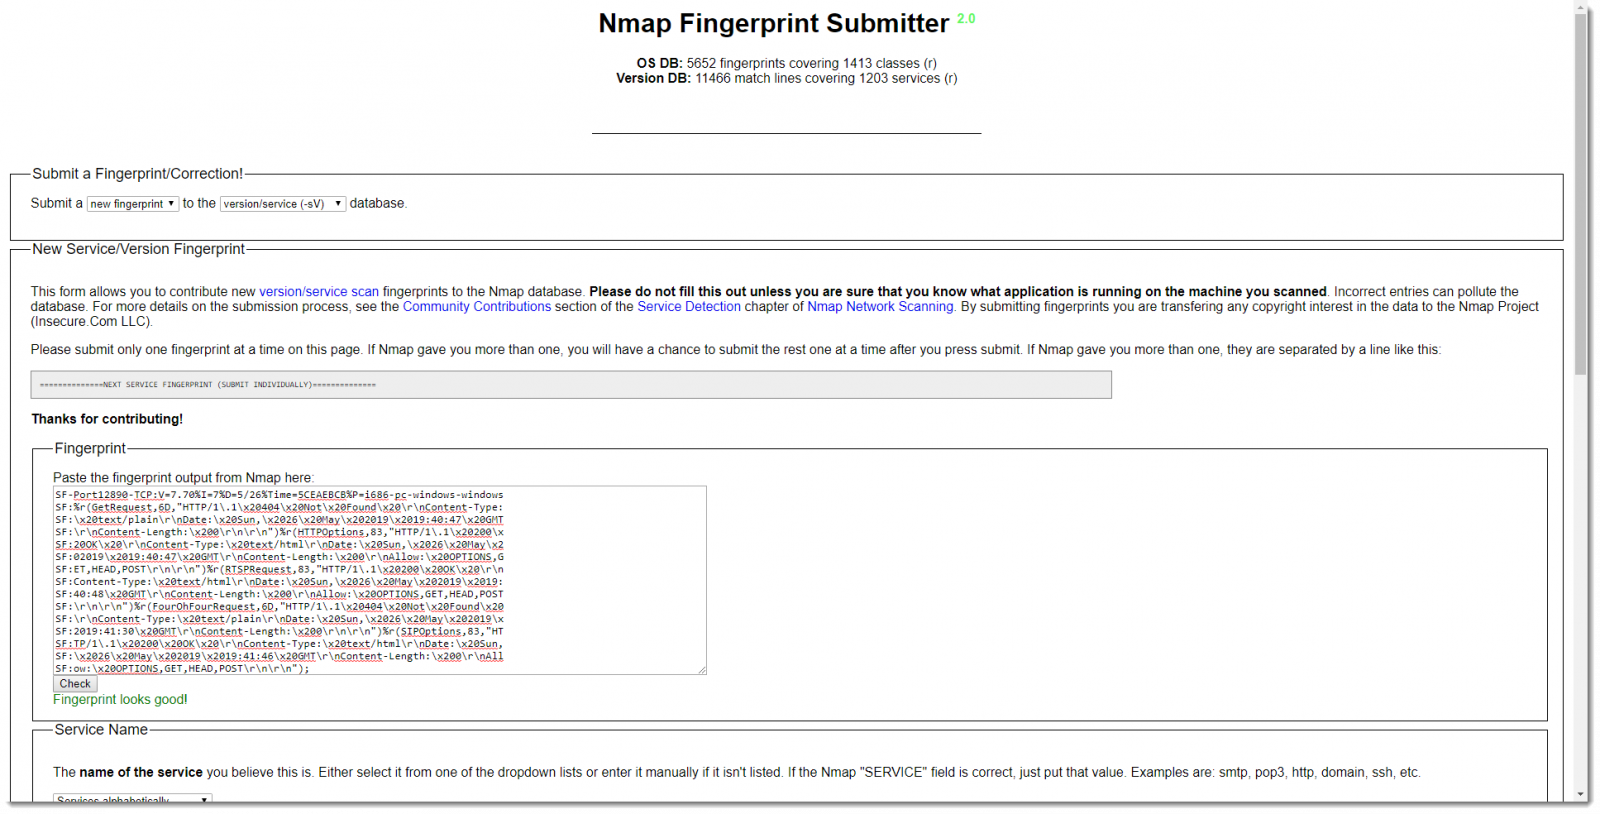
If you have an idea which service might be listening, you can submit this fingerprint on the nmap site.

But you can also take a look at the service fingerprint yourself, and maybe you'll recognize some replies. The problem is that the fingerprint looks quite difficult to understand, but that's mainly because of the format. Some simple edits will make the fingerprint more readable.
First, the fingerprint is wrapped over several lines: character sequence "\nSF:" is used to indicate a line-wrap. Next, the different fields that make up a fingerprint are separated by character %.
When you remove the line-wrap character sequence, and replace % with a newline, the fingerprint becomes easier to read:

The fingerprint starts with SF, the portnumber and the protocol. Next you have the following fields:
- nmap version
- service detection intensity
- month/day of the scan
- epoch (hexadecimal)
- platform
And then you have reply records: r(...).
The first field of a reply record is the name of the request (can be found in the nmap service probe file), the size of the reply (hexadecimal) and the (truncated) content of the reply.
Just looking at the replies might give you a hint for the type of service you are scanning.
If you have an idea which service is running, and how to detect it, you might even make a custom signature. I show how to do this in the following video:
Didier Stevens
Senior handler
Microsoft MVP
blog.DidierStevens.com DidierStevensLabs.com


Comments