What's Normal? DNS TTL Values
I am trying to start a series of brief diaries about "what's normal." Analysts often only look at the network when they suspect something is wrong. But to find the anomaly, someone must first know what's normal. So, I am trying to collect data from my home network to show what to consider. The values I am presenting here are normal for my home network and will likely differ for your network. So, instead of just copying/pasting, run the experiment yourself :)
For this first installment, I am looking at the DNS TTL values. Each DNS response includes a "Time to Live" (TTL). This is the time the answer is good for; your host or recursive DNS server will cache the answer for that many seconds. An answer retrieved from a recursive server will use the TTL remaining for the recursive server. A recursive server that 20 seconds ago received an answer with a TTL of 60 seconds will report a TTL of 40 seconds. The TTLs you observe may depend on the traffic you are collecting. You will see a more diverse set of TTLs if the answers are received from a recursive server. Answers from an authoritative server are likely clustered around common values like 60, 3600 (one hour), or 86400 (one day).
So, what are the median TTLs for each record type? (I am using the median. A few outliers were throwing off the average too much).
| Query Type | Rounded Median TTL |
| NS | 500,000 |
| MX | 1800 |
| PTR | 1800 |
| TXT | 300 |
| AAAA | 92 |
| A | 60 |
| SOA | 60 |
"NS" and "MX" records being long-lived is no surprise. You will not change your DNS and Mail servers all the time, and MX records poing to hostnames. If you intend to fail over an MX record, you update the A/AAAA records for the hostname. It is interesting that AAAA records are slightly longer lived than A records. But in line with the fact that "mobile IP" for IPv6 is a myth and operationally, IPv6 is treated just like IPv4. SOA records must be updated whenever any other records are updated. Keeping it's TTL small makes sense.
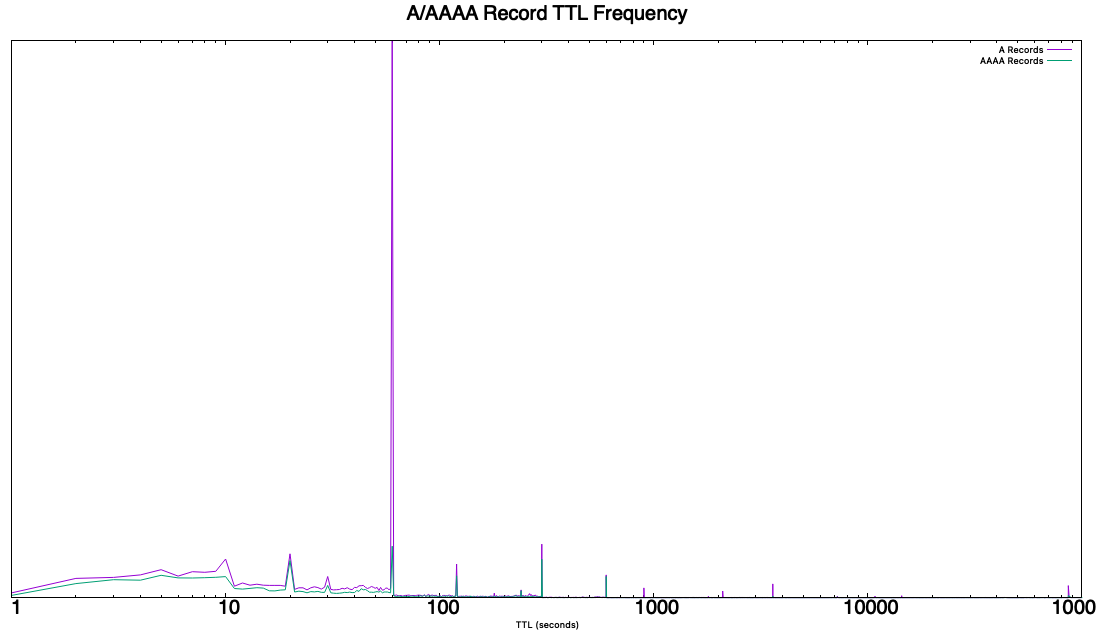
What about the distribution of records? A and AAAA records are remarkably similar (as expected from the similar median?). I sued a logarithmic x-axis to display the smaller TTL values properly.
(click on the image for the full resolution)
---
Johannes B. Ullrich, Ph.D. , Dean of Research, SANS.edu
Twitter|
| Application Security: Securing Web Apps, APIs, and Microservices | Orlando | Mar 29th - Apr 3rd 2026 |


Comments
msp
Sep 20th 2023
2 years ago
Phi
Sep 22nd 2023
2 years ago