DShield Traffic Analysis using ELK
Using the Kibana interface, sometimes it can be difficult to find traffic of interest since there can be so much of it. The 3 logs used for traffic analysis are cowrie, webhoneypot and the firewall logs. Other options to add to the honeypot are packet capture, netflow and Zeek.
Using the following steps, I was able to start selecting what could be interesting activity by using a few simple steps in the interface. This search can take place over 24 hours to several days depending on the data stored and available.
First, I'm going to look at some of the basic traffic collected by the honeypot using the firewall data. I'm going to set the time range to start at 7 days and select DShield - Traffic Analytic. My search is going to be simple, look for Source Port or IPID that could be associated with some tools that might be associated with potential reconnaissance captured by the firewall. Anything that is static with a high count might be something to use as a starting point (port equal to 0, IPID equal to 1, 54321, etc). In this case, I'm selecting IPID 54321 as a starting point.
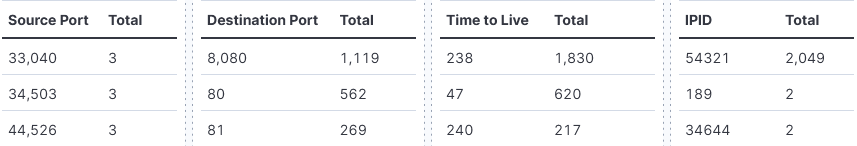
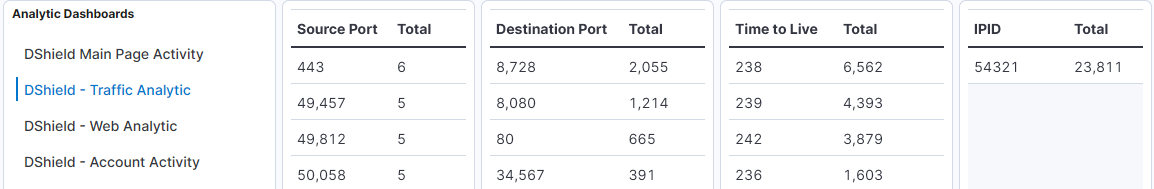
Now that I have made a choice, I look for the past 30 days and found the activity range between 4 Feb 2025 - 6 March 2025 and here is the result after selecting 54321:
My next step, I want to see traffic that all the sensors have captured from this source, using the following filter, using a DSL query, this will show all 3 sensors where this IP was captured by the firewall:
{
"terms": {
"host.name": [
"picollector",
"collector",
"vps-711a413c"
]
}
}
Next, I selected one of the IPs that all 3 sensors captured traffic from it:
related.ip : 193.68.89.10
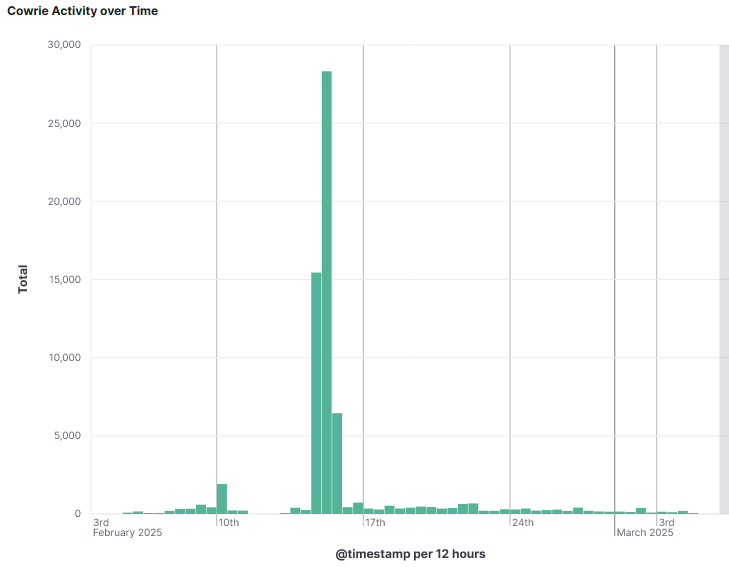
The activity from this IP started on the 5 February at 12:00 UTC and has been basically scanning ever since with a small stop gap between the 11-13 Feb and completely stopped on the 4 March 12:00 UTC
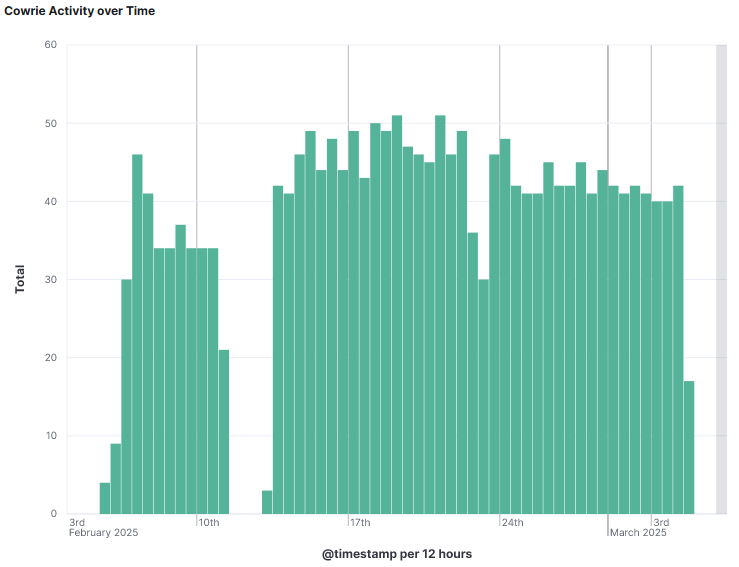
I temporary disable the IPID 54321 to see all the DShield sensor data captured over time. For this IP, only web honeypot and firewall data exists. During that time period, there were no attempts to login the sensor. This also presents a completely different picture of the activity. The 15 February shows a huge spike of web activity.
Next, going to DShield - Web Analytic, the only web activity by this IP is GET & HEAD / and 2 different user-agents.

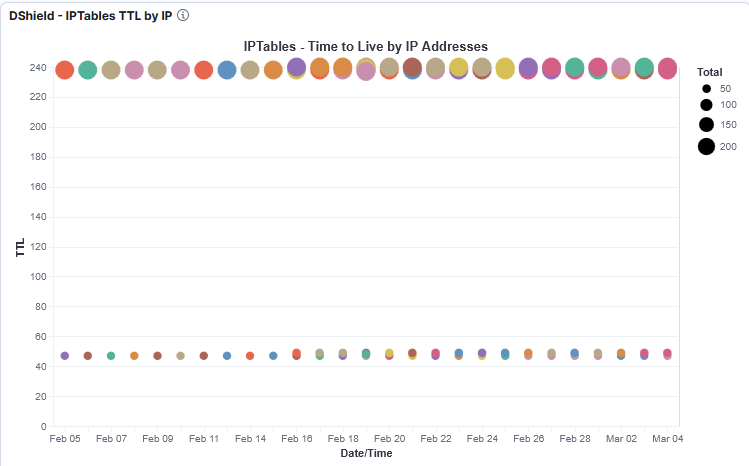
In DShield - Vega-Lite, what I find sometimes interesting is the Time-to-Live (TTL) overtime where all the activity isn't sitting around the same cluster. For example, looking at the picture below, we have two TTL cluster for the same source IP. One between 237-240 and the other between 47-49. Why a difference in the time the packet was sent to receive by the sensor? Different routes, proxy, crafting, etc.
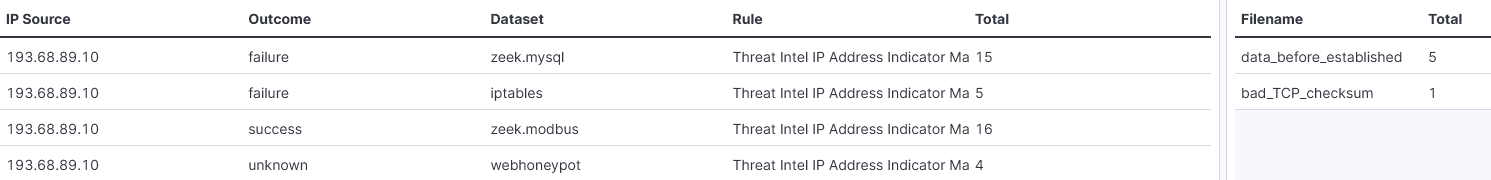
In DShield - SIEM Alerts, this source IP also alerted from some of the threat intel tracked by the SIEM [1][2].
This analysis could also use packets and Zeek if captured to dig further in the data the basic sensor logs have stored. These were simple steps to perform some retrospective analysis over time of a single IP that took at the most 10 minutes. Happy threat hunting!
[1] https://github.com/bruneaug/DShield-SIEM
[2] https://github.com/bruneaug/DShield-Sensor
[3] https://isc.sans.edu/diary/Using+ESQL+in+Kibana+to+Queries+DShield+Honeypot+Logs/31704
[4] https://isc.sans.edu/diary/Is+that+It+Finding+the+Unknown+Correlations+Between+Honeypot+Logs+PCAPs+Guest+Diary/30962
-----------
Guy Bruneau IPSS Inc.
My GitHub Page
Twitter: GuyBruneau
gbruneau at isc dot sans dot edu


Comments