Windows Error Reporting: DFIR Benefits and Privacy Concerns
This post is a guest diary by Renato Marinho. If you have any technical posts like this you would like to share with our community; please let us know.
-
Introduction
Recently, I was confronted with a scenario where a very suspicious Windows pop-up message was shown to a specific user on a corporate network. It was a kind of “Yes/No” default Windows Dialog Box that, although I cannot reveal the message content, I can assure you that it was in the context of what the user was doing on his computer at that moment.
As we were dealing with a major incident on the same network, our first assumption was that someone had compromised that machine and was controlling it remotely through a reverse connection - the type of situation that urges for a rapid response.
However, after a few hours hunting for any piece of malware on that machine, including operating system events, network connections, user Internet history, e-mail attachments, external devices and so on, nothing interesting was found. In fact, the evidence came from a source I’ve never imagined could help me on an incident response. It came from Windows Error Reporting (WER), as described in this diary.
-
The subtle clue
As no malware evidence was found, we decide to get back to the drawing board, and after looking carefully at the strange message, I noticed that, whatever application had been used by the “attacker” to present the message, it has hanging. The classic “(Not Responding)” string was shown in the dialog window title, as seen in Figure 1.
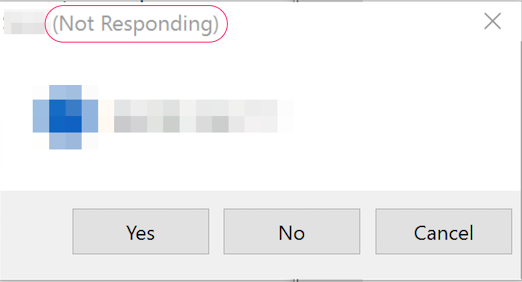
Figure 1 – “Not Responding” application sample
By default, when an application hangs or crashes on a Windows system, the Windows Error Reporting (WER) mechanism [1] automatically gathers detailed debug information including the application name, loaded modules and, more important, a heap dump, which comprehends the data that was loaded in the application at the time that the memory was collected. All this data is reported to Microsoft that, in turn, may provide users with solutions for known problems.
As the application used to send the strange message has hanged, the chances are that we could find generated WER artifacts do analyze and track the supposed intrusion. Thus, our next step was looking for them.
-
Collecting WER information
To demonstrate how we found and analyzed WER files related to that hanged application without exposing real incident information, we’ve created a similar scenario and used it for this analysis.
-
Crashing an application
Using a Windows 10 default installation machine in our lab, the first thing was forcing an application to crash. For this purpose, we used the text editor application Notepad++ as the application to be crashed and Process Explorer tool [2] as the means to cause it.
For further analyses purposes, we typed a simple text on the editor, as seen in Figure 2 and, through the Process Explorer, started killing aleatory ‘ntdll.dll’ threads, as shown in Figure 3.
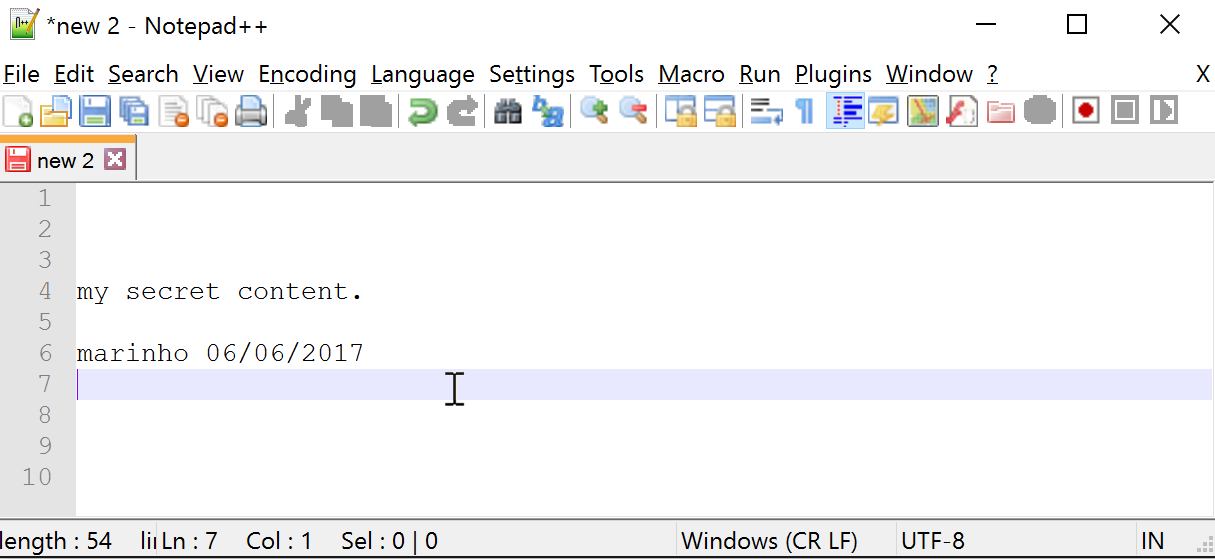
Figure 2 – Application to be crashed
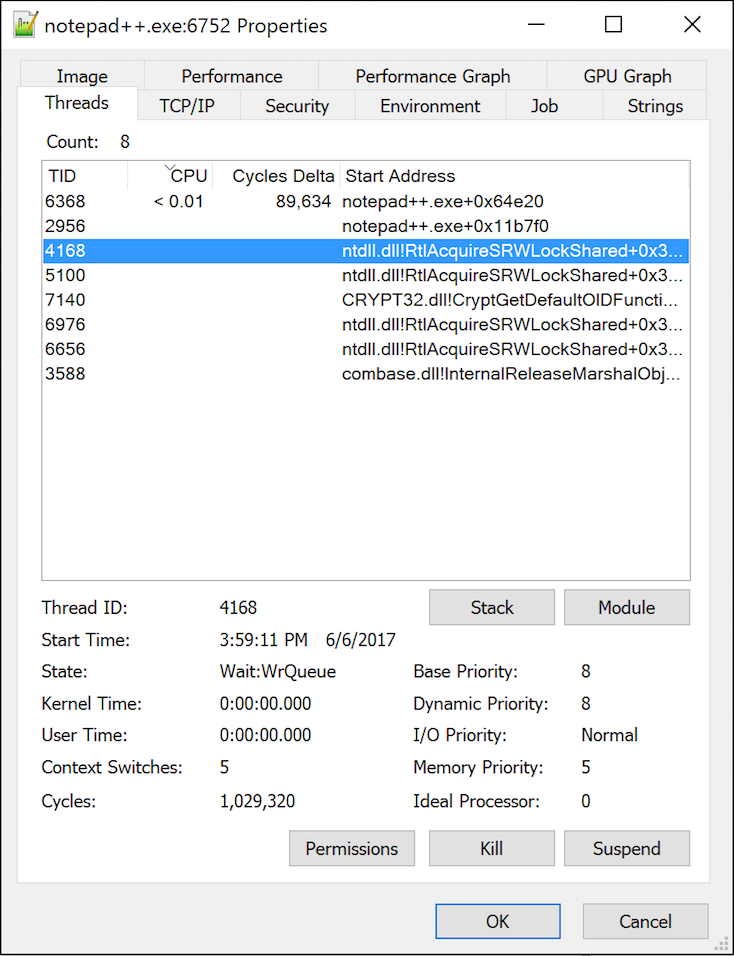
Figure 3 – Killing application threads
It didn’t take long for the application get unstable and crash. Exactly at 4:00:11 PM the application stopped working, and Windows started collecting information about the problem, as seen in Figure 4. That was WER into action.
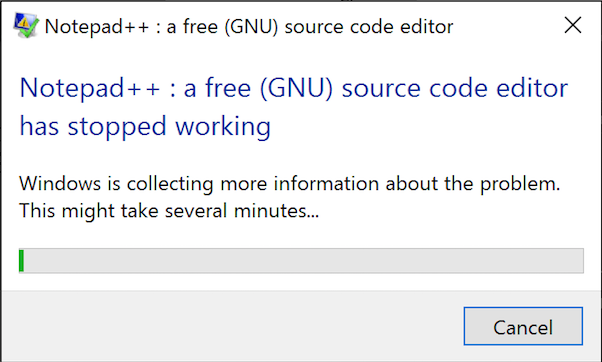
Figure 4 – WER collecting information about crashed application
-
Looking for evidence
The WER process execution leaves its tracks on the system. One of them is an error log entry detailing the application crash, as shown in Figure 5.
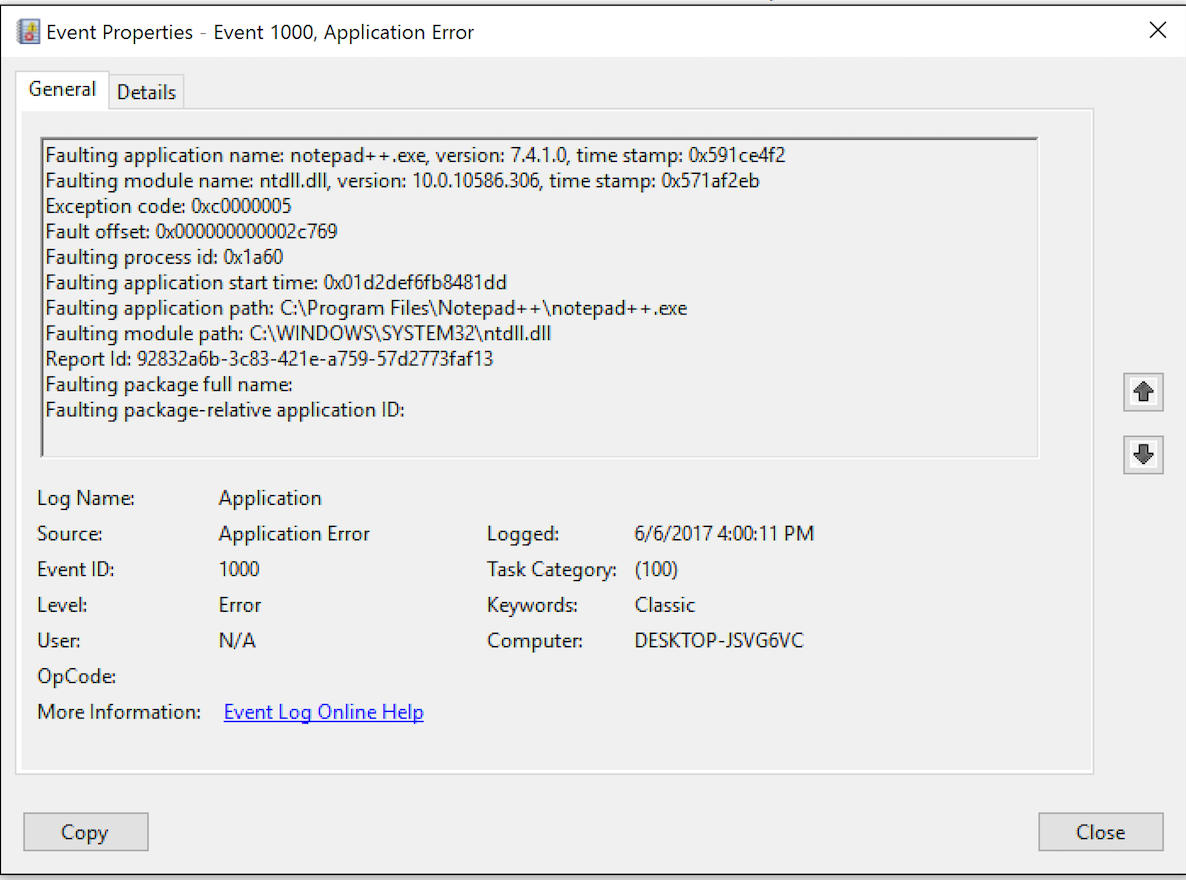
Figure 5 – Application event log evidence
Note that the event ID for crashed application has the value 1000 while for hangeing applications, the value is 1002.
The other evidence are the WER files themselves which, depending on the Windows version are generated in different paths and can be found through different control panel menu options. On Windows 7, for example, WER settings and reporting access can be found through Action Center and on Windows 8 through Problem Reports and Solutions.
On Windows 10, used in our demonstration scenario, the WER menu can be opened through the menu Control Panel -> System and Security -> Security and Maintenance -> Reliability Monitor. In Figure 6 you can see an example of this menu from which a specific error can be selected for further details.
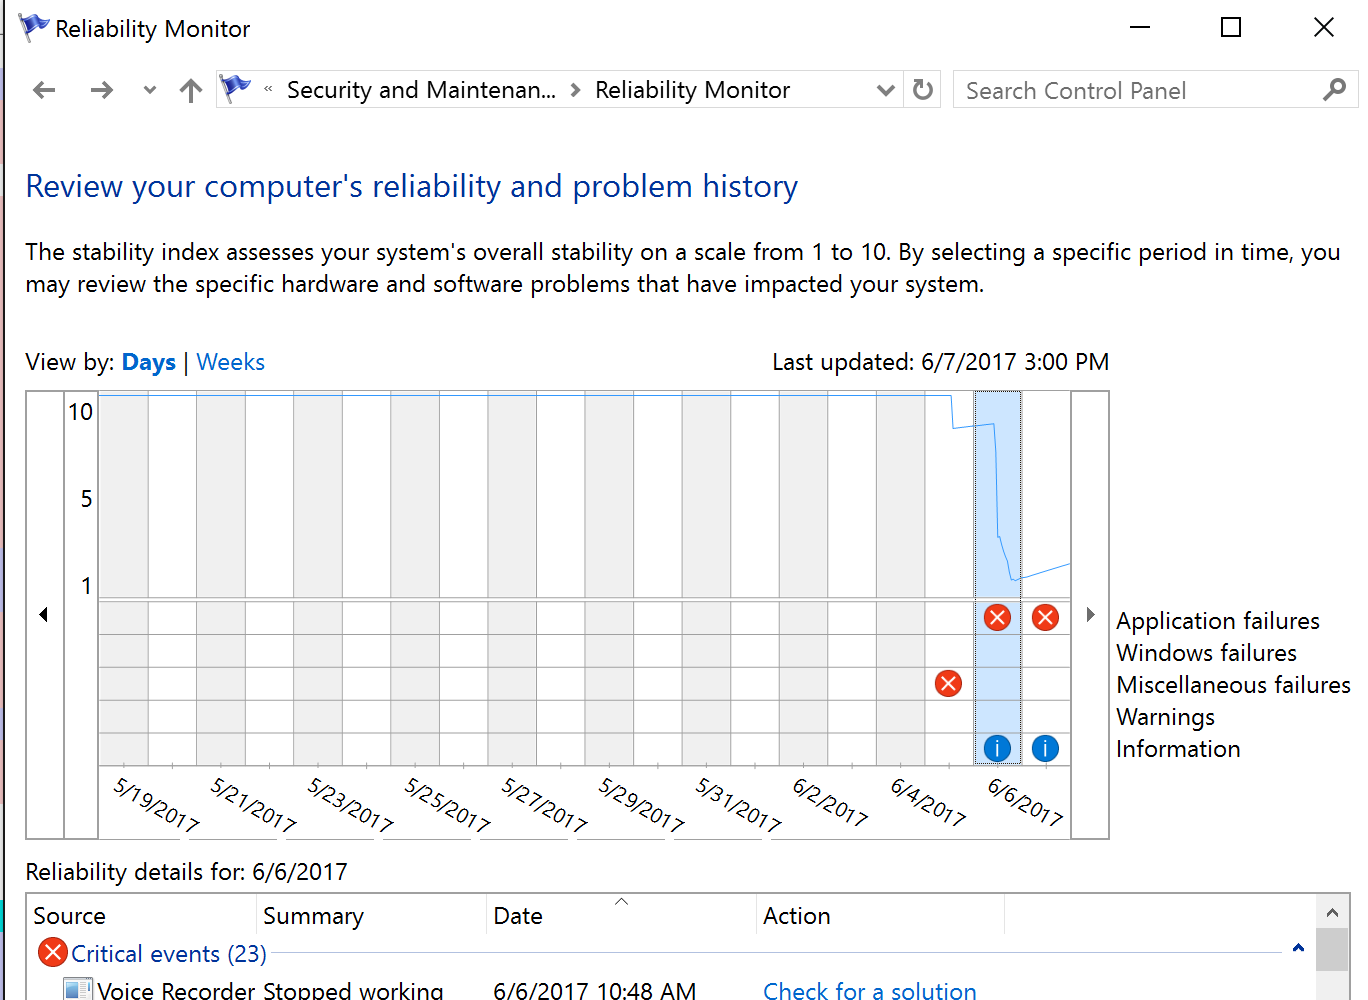
Figure 6 – Looking for the specific problem report
So, opening the details for our crash event, as shown in Figure 7, we can have access to the files generated by WER. IMPORTANT: depending on WER configuration you have chosen, those files are going to be sent to Microsoft and, after that, deleted from the disk. This is the default behavior that may be changed thorough Windows Registry [3] modifications.

Figure 7 – WER problem details
Another way to find WER files is going directly path they are created on the disk. On Windows 10, WER report files can be reached through the path: “%SystemDrive%\ProgramData\Microsort\Windows\WER”. In Figures 8 and 9, you can see the files generated for our demonstration scenario.
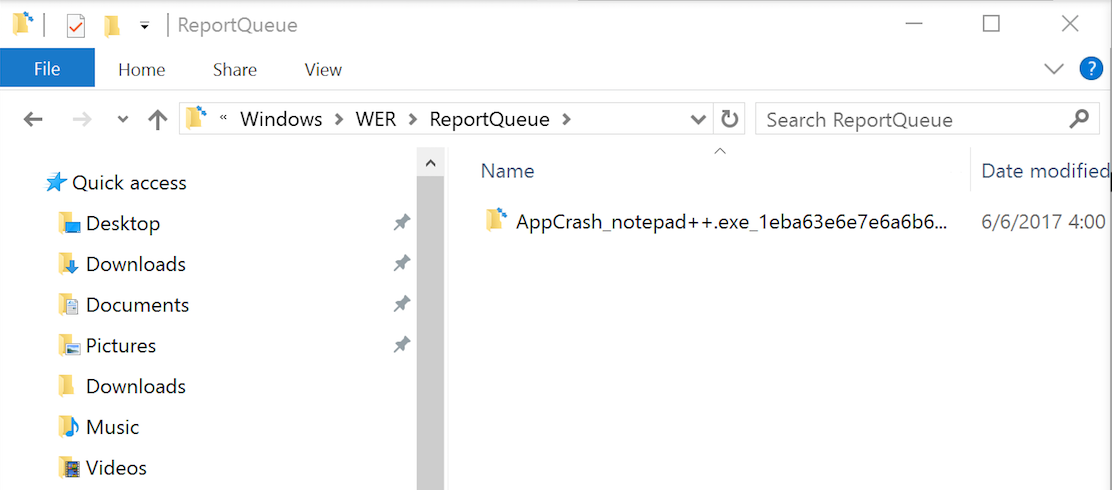
Figure 8 – WER file path
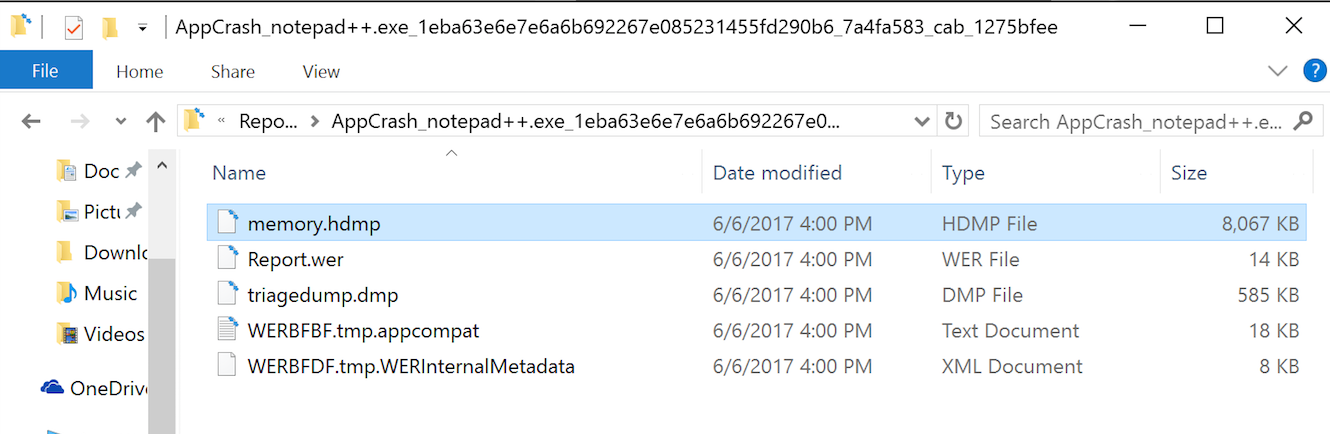
Figure 9 – WER file list
-
Analyzing the evidence
Now, making a parallel to the real incident case, when we searched for event log evidence, we could find that an application hanged on that machine moments before the message screenshot time. Better than that, we also could find the WER files associated to that application hang!
You may be thinking right now how I could find WER files in the machine as they are deleted from disk after being sent to Microsoft. The point is: they weren’t sent. Those are my hypothesis for that:
-
The machine was disconnected from the network moments after the strange message appeared, avoiding Windows to send the report to Microsoft;
-
The WER report wasn’t sent to Microsoft due to the SSL inspection employed on that network Internet access.
Although the hypothesis 1 may be plausible, according to the experiments we have done trying to validate the hypothesis 2 using SSL inspection (in other words, a man-in-the-middle attack), our Windows instance avoided to send WER reports and returned an error message, as seen in Figure 10.
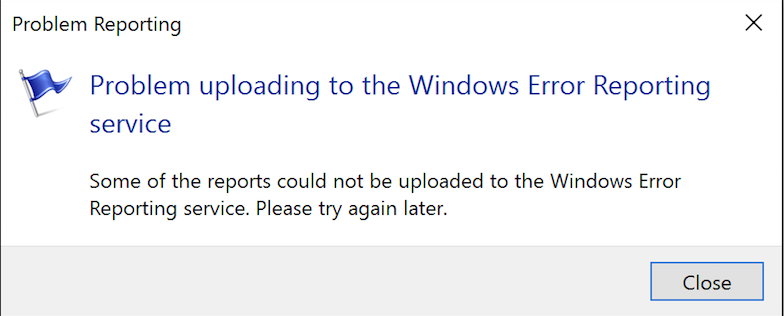
Figure 10 – Problem uploading WER during the MITM attack
Heading back to the real scenario, with WER files in our hands, we could discover the name of the possible application that generated that suspicious pop-up message and, by inspecting the heap dump file we could confirm it. It turns out that we found exactly the pop-up message content into the memory dump file using a simple “strings” command – although there exist an orthodox way to inspect and debug those files using “Windbg” [4].
Employing the same “strings” method to look for the text I typed into the Notepad++ before we crash it, we have the result shown in Figure 11.

Figure 11 – Evidence found
-
Final words
As we could see, in addition to helping Windows users to deal with application crashes and hangs, this case demonstrated that WER can be extremely useful for post-mortem analysis. Depending on the scenario, it’s like having an application memory dump to analyze as part of your DFIR activities without having collected it during the incident.
On the other hand, it raises some concerns regarding data leaking through the memory dump files. Considering that you have consented to send those information to Microsoft (remembering or not that you have done that [5]), there exists the possibility of those content to be accessed by third parts, like intruders that escalated the privileges on the targeted machine or simple by that new employee that is now using your machine and you thought that removing your user home directory could be enough.
Things may get worse if we consider that the crashed or hanged application is a password manager, for example. We did experiments on a group of them and privately reported those that allowed us to recover clear text passwords from WER memory dumps. The Enpass password manager has already published a security bulletin and a new version fixing the vulnerability [6] for which the CVE 2017-9733 [7] has been associated.
For Windows application developers in general, to prevent sensitive information exfiltration from crash dumps, we recommend either completely disabling WER triggering by using AddERExcludedApplication or WerAddExcludedApplication functions [8] or by excluding the memory region that may contain sensitive information using the function WerRegisterExcludedMemoryBlock [9] (available only on Windows 10 and later).
A more comprehensive solution should be provided by Windows itself that could protect report files by encrypting them - at least the memory dumps. Interestingly, there is a patent from IBM exactly about protecting application core dump files [10]. Today, the encryption is employed only while sending WER report files to Microsoft through SSL connections.
Regarding our case, in the end, fortunately realized that there was no violation or intrusion on that machine. It was, indeed, a misuse of a legitimate tool by an internal employee that made us learn a bit more the importance of WER files to digital forensics and user’s privacy.
-
References
[1] https://msdn.microsoft.com/en-us/library/windows/desktop/bb513613(v=vs.85).aspx
[2] https://technet.microsoft.com/en-us/sysinternals/processexplorer.aspx
[3] https://msdn.microsoft.com/pt-br/library/windows/desktop/bb513638(v=vs.85).aspx
[4] https://blogs.msdn.microsoft.com/johan/2007/11/13/getting-started-with-windbg-part-i/
[5] https://privacy.microsoft.com/en-US/windows-10-feedback-diagnostics-and-privacy
[7] https://cve.mitre.org/cgi-bin/cvename.cgi?name=2017-9733
[8] https://msdn.microsoft.com/en-us/library/windows/desktop/bb513635(v=vs.85).aspx
[9] https://msdn.microsoft.com/en-us/library/windows/desktop/mt492587(v=vs.85).aspx
Renato Marinho
Morphus Labs | linkedin.com/in/renatomarinho | @renato_marinho


Comments