Using scdbg to Find Shellcode
I've written a couple of diary entries about scdbg, a Windows 32-bit shellcode emulator.
If you're not familiar reading assembly code or machine language, scdbg can help you understand what shellcode is doing, by emulating it and reporting relevant Win32 API calls.
By default, scdbg assumes that the shellcode's entrypoint is the first instruction, e.g. position 0. That's not always the case, and you can use option -foff to provide a different position (offset). But this assumes that you know where the shellcode's entrypoint is. And determining this can be difficult too when you analyze malware.
To help you locate shellcode's entrypoint, or just find shellcode inside a file, scdbg has an option: -findsc.
As an example, I created a JPEG file that contains shellcode (not an exploit, the shellcode will not execute, it's just hidden inside a JPEG image).
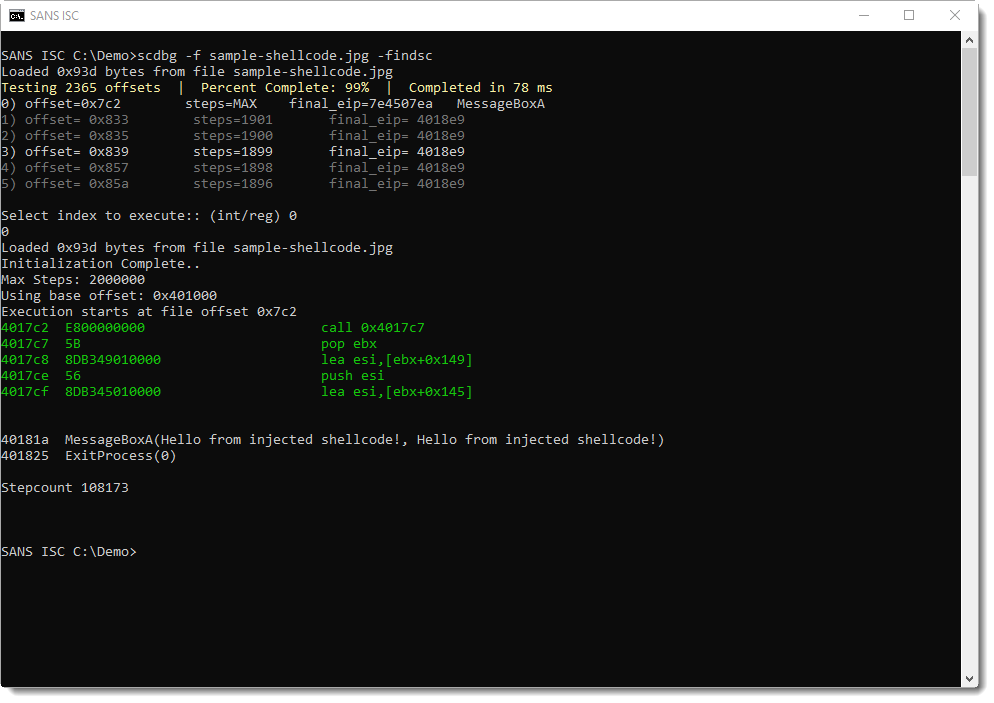
Giving this file as input to scdbg using option -findsc does the following:

scdbg tries all possible entrypoints to the shellcode in this file, and then reports entrypoints (offsets) that lead to emulations that resulted in a Win32 API call or a long execution (many steps).
In the screenshot above, we see that scdbg found 6 offsets (numbered 0 through 5). Entry 0 looks promising (offset 0x7C2), as this lead to the call of MessageBoxA.
scdbg then prompts for the index of the shellcode's offset to emulate. I select 0 and get the following result:

This is indeed shellcode that was found at position 0x7C2: it displays a message box and then terminates the host process.
Didier Stevens
Senior handler
Microsoft MVP
blog.DidierStevens.com DidierStevensLabs.com


Comments