Live memory analysis using Rekall
If you are doing memory forensics using Volatility, maybe you have noticed that one of the disadvantages that you can’t do a live analysis. If you need to do live memory forensics, then Rekall is your best friend.
Rekall can be obtained from the following location:
https://github.com/google/rekall/releases
Rekall supports the following Operation systems:
- Microsoft Windows XP Service Pack 2 and 3
- Microsoft Windows 7 Service Pack 0 and 1
- Microsoft Windows 8 and 8.1
- Microsoft Windows 10
- Linux Kernels 2.6.24 to most recent.
- OSX 10.7-10.12.x.
For this diary, I am going to use Rekall for Windows. The installation is straightforward.
Rekall needs to be run as administrator to perform the live analysis. Unfortunately, sometimes you need to specify the profile to do the analysis. To find the right profile type the following command inside the Rekall console:
|
version_scan name_regex="krnl" |
Now locate the guid for ntkrnlmp.pdb
In my case its “5B396742883C48D0AB74C7374DEEE9161”
Now exit from rekall console by typing:
|
quit |
Now run rekall again with the following command (notice that I have provided the guid in the command):
|
rekal live --profile=nt/GUID/5B396742883C48D0AB74C7374DEEE9161 |
Now we can play with rekall , here are some examples,
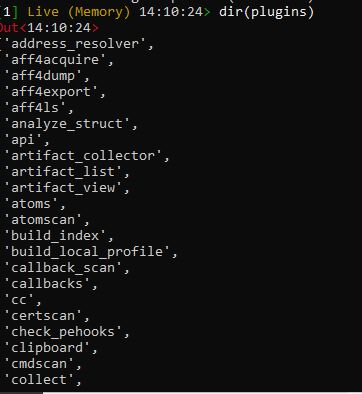
To list the available plugins
|
dir(plugins) |
List the running process:
|
pslist |
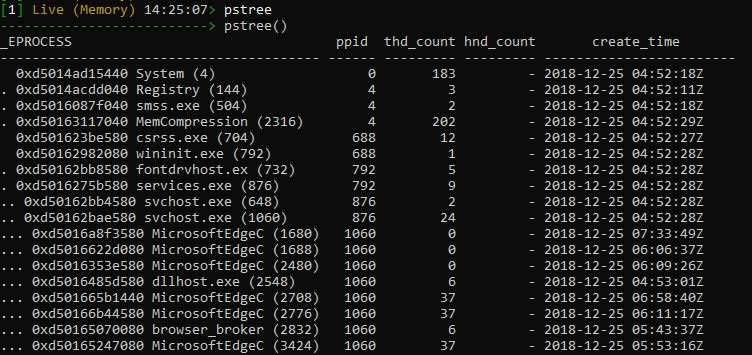
To list the process tree:
|
pstree |
To view the services and save the output to services.txt
|
services(output="services.txt") |


Comments