Happy FouRth of July from the Internet Storm Center
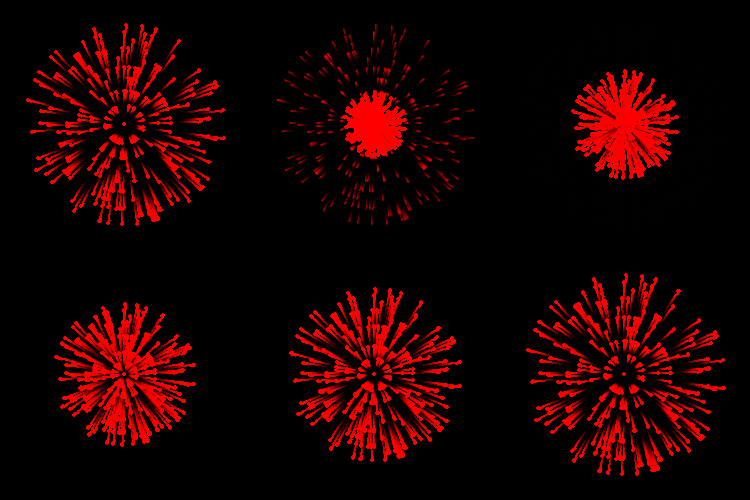
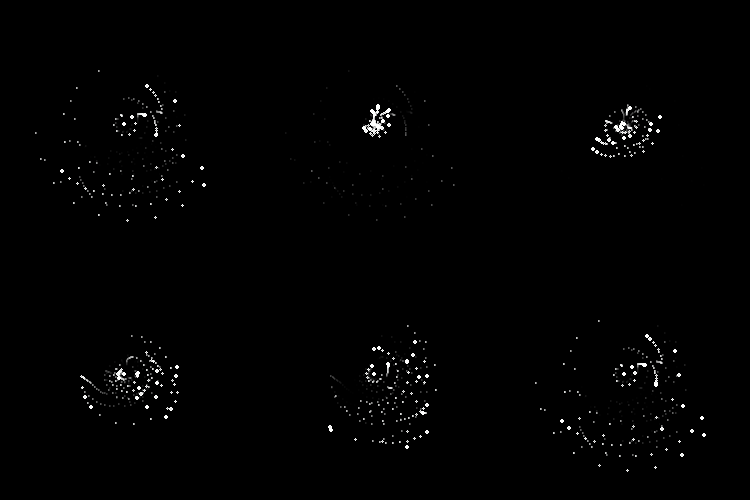
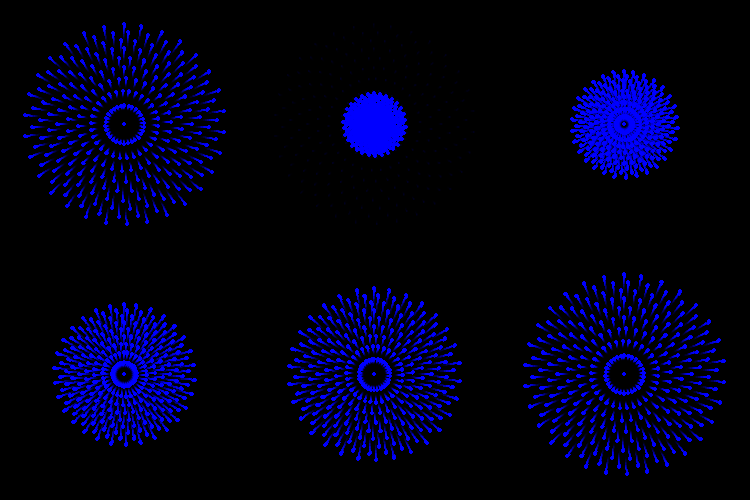
For our readers in the United States, the 4th of July is Independence Day. As the 4th, under normal COVID-free circumstances, is typically celebrated with fireworks events, I thought I'd deviate a bit from information security topics and instead share a bit of code to create your own fireworks using R, a language and environment for statistical computing and graphics. My teams and I use R and Python constantly as part of security data analytics, particularly for data science and machine learning to further our detection practices and better identify anomalies of significance. You can follow along at home using RStudio as your IDE, and the latest version of R, 4.0.2 as this is written. All credit is due specifically to Edward Visel of Uptake, this is entirely his code, just modified ever so slightly for our purposes here. Edward was experimenting on his path to the perfect R-generated firework but I like each of them as variants in and of themselves. In the spirit of the old red, white, and blue, I selected three specific patterns, namely his explosion, particles and gnats, and the final firework. This work uses the tidyverse, sf, and gganimate packages, I pulled in magick to manipulate the resulting GIFs a bit. If you just want the TL;DR version, the results of the effort follows immediately, the code is in-line immediately thereafter. Happy 4th of July for those of you who celebrate it, cheers, stay safe and healthy to all!


library(tidyverse)

library(sf)

library(gganimate)

library(magick)
theme_set(theme_void() + theme(

  panel.background = element_rect(fill = 'black')

))
#Explosion

p1 <- map_dfr(1:10, ~crossing(

  x = runif(30),

  nesting(

    y = seq(1, .x, length.out = 10)^0.5,

    t = 1:10)

)

) %>%

  ggplot(aes(x, y)) +

  geom_point(color = 'red') +

  coord_polar() +

  transition_time(t) +

  shadow_wake(0.5)
p1_gif <- animate(p1, renderer = gifski_renderer(), fps = 50,

                  width = 250, height = 250)
#Particles & Gnats

p2 <- map_dfr(1:10, ~tibble(y = seq(1, .x, length.out = 10), t = 1:10)) %>%

  mutate(x = runif(n())) %>%

  ggplot(aes(x, y)) +

  geom_point(color = 'white') +

  coord_polar() +

  transition_time(t) +

  shadow_wake(0.5)
p2_gif <- animate(p2, renderer = gifski_renderer(), nframes = 70, fps = 50,

                  width = 250, height = 250)
#Firework
p3 <- map_dfr(1:10, ~crossing(

  x = {

    x = seq(30) + 0.6*.x;

    ifelse(x > 30, x - 30, x)

  },

  nesting(

    y = seq(1, .x, length.out = 10)^0.5,

    t = 1:10)

)

) %>%

  ggplot(aes(x, y)) +

  geom_point(color = 'blue') +

  coord_polar() +

  transition_time(t) +

  shadow_wake(0.3)
p3_gif <- animate(p3, renderer = gifski_renderer(), fps = 50,

                  width = 250, height = 250)
p1_mgif <- image_read(p1_gif)

p2_mgif <- image_read(p2_gif)

p3_mgif <- image_read(p3_gif)
image_write(p1_mgif, path = "red.gif", format = "gif", quality = 75)

image_write(p2_mgif, path = "white.gif", format = "gif", quality = 75)

image_write(p3_mgif, path = "blue.gif", format = "gif", quality = 75)


Comments
https://grafana.com/
https://prometheus.io/
Anonymous
Jul 4th 2020
5 years ago