ELK Dashboard and Logstash parser for tcp-honeypot Logs
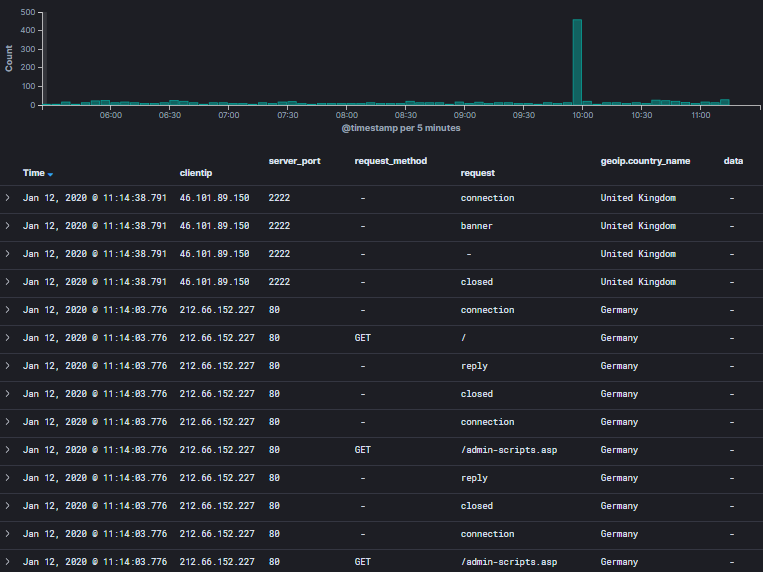
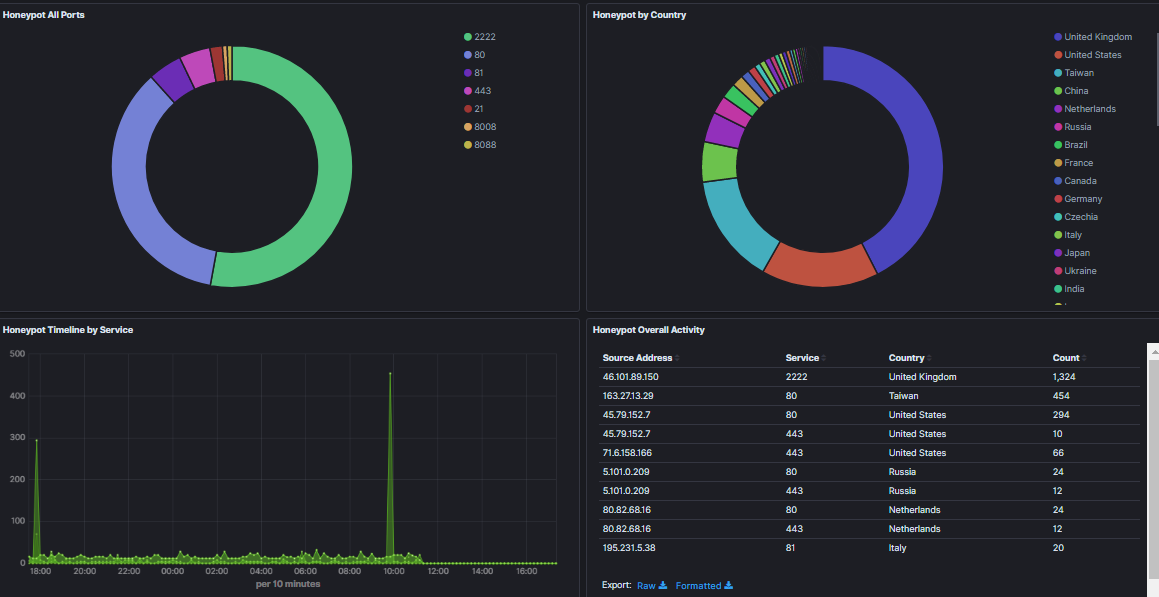
In my last two diaries, I shared a Pihole parser and dashboard to collect and view its logs in Elastic. In this diary, I'm sharing another parser and dashboard to visualize the data collected by Didier's tcp-honeypot. This is a work in progress.
tcp-honeypot Log Analysis from Discover
tcp-honeypot Dashboard Summary
The file tcp-honeyport parser can be downloaded here and the dashboard JSON here.
[1] https://github.com/DidierStevens/Beta/blob/master/tcp-honeypot.py
[2] https://handlers.sans.edu/gbruneau/elk/honeypot.conf
[3] https://handlers.sans.edu/gbruneau/elk/honeypot_graphs.ndjson
[4] https://handlers.sans.edu/gbruneau/elk/pihole.conf
[5] https://handlers.sans.edu/gbruneau/elk/pihole_graphs.ndjson
-----------
Guy Bruneau IPSS Inc.
My Handler Page
Twitter: GuyBruneau
gbruneau at isc dot sans dot edu


Comments
https://www.minds.com/media/884629970573185024?referrer=linuxgeek
https://www.minds.com/newsfeed/1016723622898040832?referrer=linuxgeek
There's more on my https://www.minds.com/linuxgeek page too.
Anonymous
Jan 14th 2020
6 years ago