Forensic Value of Prefetch
[This is a guest diary submitted by Logan Flook]
When a program executes on a Windows system there are many artifacts that are generated which can assist digital forensic investigations. One of particular note is the Windows Prefetch file. Found in C:\Windows\Prefetch by default, prefetch files (.pf) contain a wealth of information that can prove vital to any investigation.
What is a prefetch file
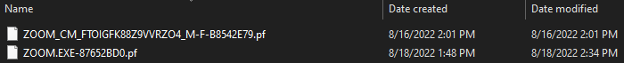
The main purpose of prefetch files from the Windows operating system’s viewpoint is to cache pieces of information over an executable after it is run. This will then allow the operating system to speed up the loading of the application in subsequent executions. Windows 8 and newer operating systems can hold a total of 1,024 prefetch files while Windows 7 and older can hold a total of 128 prefetch files. The default naming convention of a prefetch file is <Name_Of_Executable>-<Hash_of_Directory>.pf. For example, the program zoom.exe could appear as ZOOM.EXE-87652BD0.pf, where 87652BD0 is a hash of the path from which zoom.exe was executed see Figure 1.

This means that there may be multiple prefetch files for the same application but correspond to separate directory locations. The timestamps of a prefetch file are arguably the most beneficial aspect of the file itself. The creation date of a prefetch file is the first time that executable was ran on a system, while the modification date of a prefetch file is the last time that executable was ran on a system, see Figure 2.
Forensic Value
As previously mentioned, timestamps are extremely important when analyzing a prefetch file. Prefetch files not only record the first and last time an executable was run on a system, but they can actually contain up to eight (8) execution timestamps, this can be seen during analysis. However, timestamps recorded by prefetch must have ten (10) seconds removed, if looking at the second-granular level. This is due to prefetch recording the activity of an application for ten (10) seconds post-execution. During this recording prefetch will document all the files and directories that an executable interacts with. These records can be specifically helpful to investigators to identify potentially malicious directory paths or binaries that an executable might have been coded to interact with.
Analysis of Prefetch Files
Although there are a variety of ways to analyze a prefetch file, a personal favorite is to utilize the tool PECmd.exe created by Eric Zimmerman. This tool is freely available on Eric’s GitHub page. When PECmd is ran against a prefetch file it will extract all the timestamp, directory, and file data that it holds. PECmd can be ran against one specific prefetch file, or against the entirety of the prefetch directory and export its results into a CSV formatted file.
Singular File Analysis
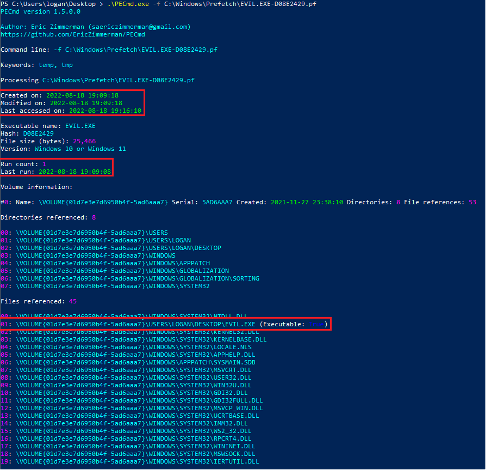
Figure 3 showcases the output received when running PECmd against a singular prefetch file. The first data received is some default output by the tool. This is followed by the Created on, Modified on, and Last Accessed on timestamps (highlighted in a red box). Immediately following that is some basic metadata concerning the executable that this prefetch file pertains to, including the name, size, and version. After that is the first big forensic value output, this is the Run Count and Last Run timestamp (highlighted in the second red box). Here we see that the analyzed executable was ran once at 2022-08-18 19:19:08. If you notice this run time is exactly ten (10) seconds earlier than the ‘Created on’ timestamp we saw above. This again is due to prefetch observing the executable for 10 seconds post-execution. Because of this observation we received the data below this run count/last run section. This being the list of Directories and Files referenced (i.e. interacted with) by the executable. Included in the ‘Files referenced’ section we have highlighted the full directory path to the executable.
Directory Analysis
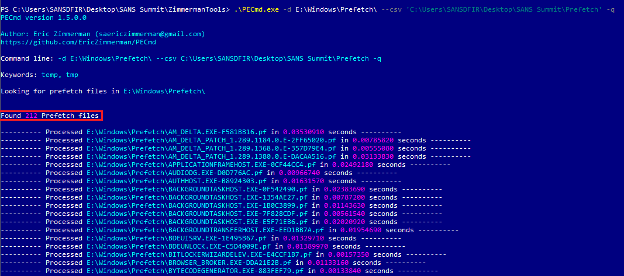
If an investigator is wanting to analyze all prefetch files found in the prefetch directory, they can do so by running PECmd against the directory itself. Seen in Figure 4 we have ran PECmd against the E:\Windows\Prefetch directory. Like the earlier output PECmd will first output some default data. Then PECmd will run against each and every prefetch file it finds and output the time that it required to extract the data. Highlighted in a red box we also pointed out that PECmd detected 212 prefetch files in this directory, this can show that the system we are running against is a Windows 8 or newer operating system.
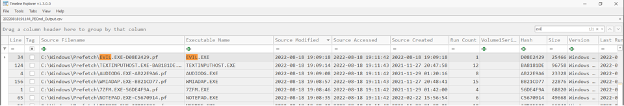
Once PECmd has concluded the output received will be a CSV formatted file. We can then analyze this file in any CSV-compatible software to investigate the different applications. In Figure 5 we have opted to use the Timeline Explorer software once again created by Eric Zimmerman and available in his GitHub.
Once opened we can search of ‘EVIL’ to have Timeline Explorer filter or search/highlight any text that contains this string. Indeed, we see PECmd has identified the EVIL.EXE file. We can now see the same data previously identified when running PECmd against the singular prefetch file. This being execution timestamps, run count, size, version, and additional data off screen.
Conclusion
Prefetch files can be an extremely helpful tool to digital forensics investigators and incident responders alike. They allow for a more thorough understanding of application execution as well as assist in timeline creation and proof of Indicators of Compromise (IOCs). Considering that prefetch is enabled by default on Windows operating systems and the availability of free and open source tools, prefetch analysis should be included in any investigation playbook.
| Network Monitoring and Threat Detection In-Depth | Online | Central European Time | Dec 15th - Dec 20th 2025 |


Comments
Anonymous
Oct 21st 2022
3 years ago