Shipping to Elasticsearch Microsoft DNS Logs
This parser takes the logs from a Windows 2012R2 and/or 2019 server (C:\DNSLogs\windns.log) and parses them into usable metatada which can be monitored and queried via an ELK dashboard. The logs have been mapped using DNS ECS field meta here [1].
→ First step is to load the Microsoft DNS templates [3][4] via Kibana Dev Tools to create the microsoft.dns Index Management and Index Lifecycle Policy. Follow the instructions at the top of each template.
→ Second step is to install Logstash (if not already done) and add to Logstash [2] this configuration file (i.e. /etc/logstash/conf.d/logstash-filter-ms-dns.conf) and start the logstash service.
This configuration file also contains the option of resolving the IP addresses to hostname and should be adjusted to reflect the local internal network. Edit logstash-filter-ms-dns.conf and change 192.168.25 to reflect the local network:
# This filter drop internal domain and internal IP range with in-addr.arpa
# This reduce the amount of noise
filter {
if [log][file][path] =~ "windns.log" {
if [dns.question.name] =~ /168\.192\.in-addr\.arpa/ {
drop {}
}
if [dns.question.name] =~ /erin\.ca/ {
drop {}
}
}
}
# DNS lookup for dns.resolved_ip that start with 192.168.25
filter {
if [log][file][path] =~ "windns.log" and [dns.resolved_ip] =~ /192\.168\.25/ {
mutate {
copy => { "dns.resolved_ip" => "source.registered_domain" }
convert => { "geoip.postal_code" => "string" }
# copy dns.question.name to related.host
copy => { "dns.question.name" => "related.hosts" }
}
dns {
reverse => [ "source.registered_domain" ]
action => "replace"
}
}
}
→ Third step, Login Windows server and setup file-based DNS debug logging
Windows DNS Debug Logging is used to collect the logs. Queries are logged one per line. Enable DNS debug logging using these steps:
- Create directory: C:\DNSLogs
- Open the DNS Management console (dnsmgmt.msc).
- Right-click on the DNS Server name and choose Properties from the context menu.
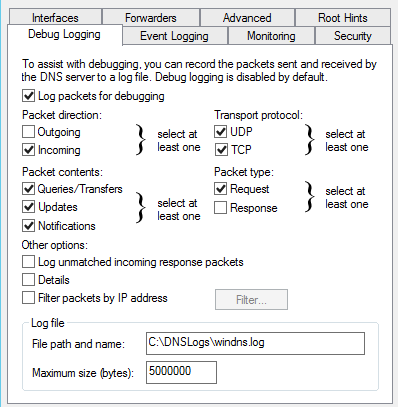
- Under the Debug Logging tab, enable Log packets for debugging and configure as per picture below.
- File path and name: C:\DNSLogs\windns.log
- Maximum size (bytes): 5000000
- Apply the changes
- Verify the file C:\DNSLogs\windns.log is now receiving data
→ Forth step is to install filebeat on the Windows server (C:\Program Files\filebeat), configured as a service and change the filebeat.yml configuration to only contain the following information. Change the IP address in this file to the IP address (192.168.25.23) of the logstash service and install the filebeat service:
# This filebeat shipper is used for
# Microsoft DNS logs
# 9 Jan 2021
# Version: 1.0
filebeat.inputs:
# Filebeat input for Windows DNS logs
- type: log
paths:
- "C:/DNSLogs/windns.log"
include_lines: ["^[0-9]{4}-"]
fields_under_root: true
#==================== Queued Event ====================
#queue.mem:
# events: 4096
# flush.min_events: 512
# flush.timeout: 5s
#queue.disk:
# path: "/op/filebeat/diskqueue"
# max_size: 10GB
#==================== Output Event ====================
output.logstash:
hosts: ["192.168.25.23:5044"]
At this point, the logs should start going to ELK. From the Windows server, verify the connection has been established to logstash by running at the command line: netstat -an | findstr 5044
In the Elasticsearch server, under Stack Management → Index Management, look for an new instance with microsoft.dns-* (something like this: microsoft.dns-2021.09.10-000001) which should start collecting Microsoft DNS metadata.
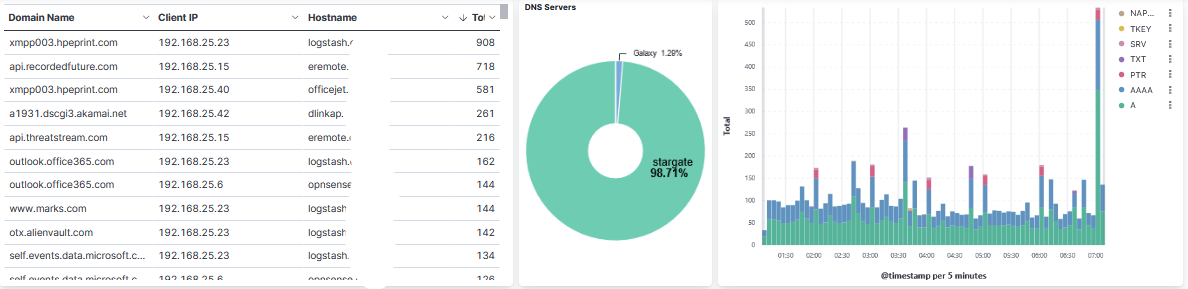
→ Last step is to load the dashboard [5] to Elasticsearch under Stack Management → Saved Objects and Import the file Microsoft_DNS_7.14_v1.ndjson, this will load the new dashboard and the Index Pattern.
Look under the Dashboard tab for Microsoft DNS Server [Microsoft DNS Tag]. This is a sample of the top part of the dashboard:
[1] https://www.elastic.co/guide/en/ecs/current/ecs-dns.html
[2] https://handlers.sans.edu/gbruneau/elk/logstash-filter-ms-dns.conf
[3] https://handlers.sans.edu/gbruneau/elk/Windows_DNS_ilm_policy.txt
[4] https://handlers.sans.edu/gbruneau/elk/Windows_DNS_template.txt
[5] https://handlers.sans.edu/gbruneau/elk/Microsoft_DNS_7.14_v1.ndjson
[6] https://isc.sans.edu/forums/diary/Secure+Communication+using+TLS+in+Elasticsearch/26902/
[7] https://www.elastic.co/guide/en/ecs/master/ecs-field-reference.html
[8] https://handlers.sans.edu/gbruneau/elastic.htm
-----------
Guy Bruneau IPSS Inc.
My Handler Page
Twitter: GuyBruneau
gbruneau at isc dot sans dot edu


Comments