Microsoft DHCP Logs Shipped to ELK
This parser takes the logs from a Windows 2012R2 server (C:\Windows\System32\dhcp) and parses them into usable metatada which can be monitored via a dashboard. The logs have been mapped using ECS in the same format as the packetbeat meta here [1].
→ First step is to load the Microsoft DHCP templates [3][4] via Kibana Dev Tools to create the microsoft.dhcp Index Management and Index Lifecycle Policy. Follow the instructions at the top of each of template.
→ Second step is to install Logstash (if not already done) and add to Logstash [2] configuration file (i.e. /etc/logstash/conf.d/logstash-filter-dhcp.conf).
The configuration file contains a Logstash filter use to compare the host MAC address OUI against a local list (in this configuration it is: oui.yml). Get OUI list from the web and convert it into a yml list saved in the /opt directory.
- In Linux, using wget, download the file:
- wget http://standards-oui.ieee.org/oui/oui.txt
- Create the list in the /opt directory and run the following command to create the OUI file (this regex will delete tabs, spaces and @ ):
- # cat /opt/oui.txt | grep 'base 16' |sed -e 's/\([[:xdigit:]]\{6\}\).*(base 16)\t\t\(.*\)\r/"\1": \2/gi' | tr -d '@' > /opt/oui.yml
Start the Logstash service and verify under Stack Mangement → Index Management for an indice similar to microsoft.dhcp-2021.03.12-000001 created.
→ Third step is to install filebeat on the Windows server, configured as a service and change the filebeat.yml configuration to only contain the following information. Change the IP address in this file to the IP address of the logstash service:
# This filebeat shipper is used with
# for Microsoft DHCP logs
# 9 Jan 2021
# Version: 1.0
filebeat.inputs:
# Filebeat input for Microsoft DHCP logs
- type: log
paths:
- "C:/Windows/System32/dhcp/DhcpSrvLog-*.log"
include_lines: ["^[0-9]{2},"]
fields_under_root: true
#==================== Queued Event ====================
#queue.mem:
# events: 4096
# flush.min_events: 512
# flush.timeout: 5s
#queue.disk:
# path: "/op/filebeat/diskqueue"
# max_size: 10GB
#==================== Output Event ====================
output.logstash:
hosts: ["192.168.2.23:5044"]
At this point, the logs should start going to ELK. From the Windows server, verify the connection has been established by running at the command line: netstat -an | findstr 5044
In the Elasticsearch server, under Stack Management -> Index Management, lock for an new instance with microsoft.dhcp-* (something like this: microsoft.dhcp-2021.03.12-000001) should start showing new metadata has been received.
→ Last step is to load the dashboard [5] to Elasticsearch under Stack Management -> Saved Objects and Import the file Microsoft_DHCP_7.11_v1.ndjson, this will load the new dashboard and the Index Pattern.
The dashboard should have this look and feel:
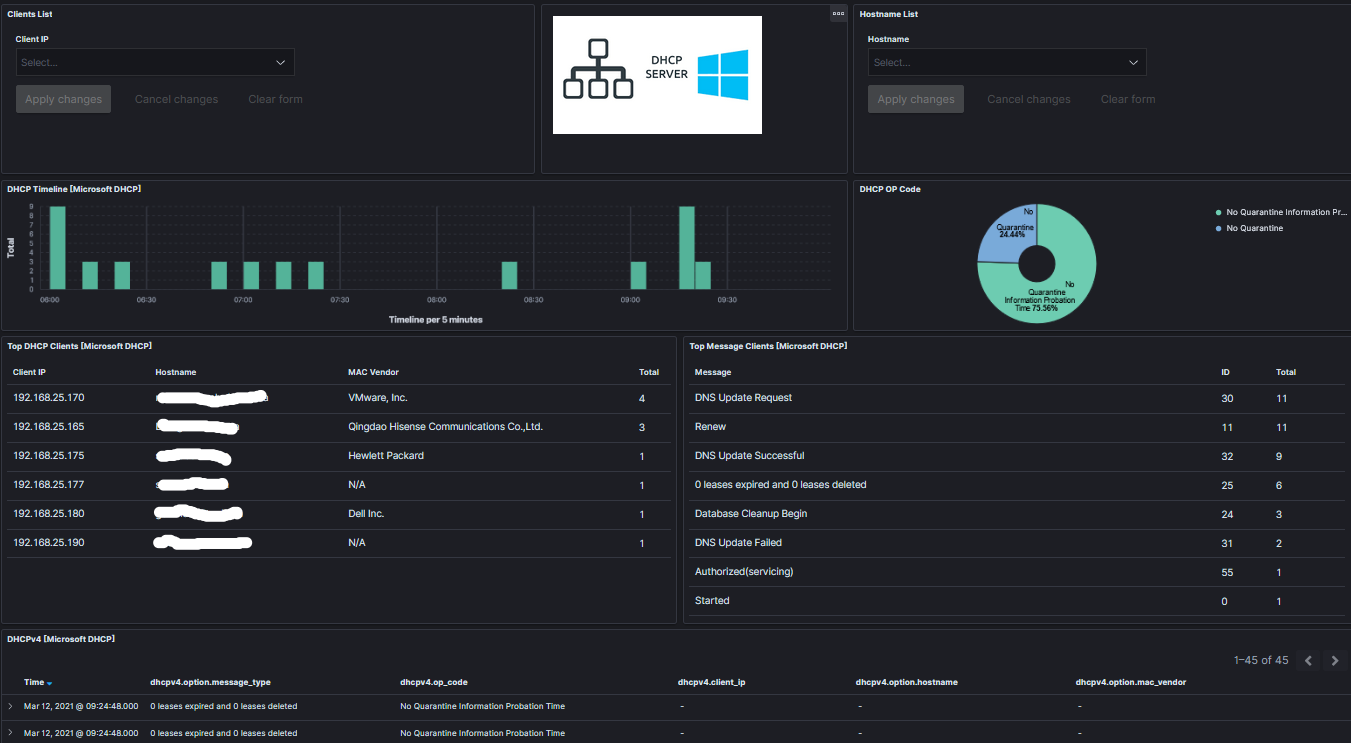
The DHCP log format being parsed:
ID,Date,Time,Description,IP Address,Host Name,MAC Address,User Name, TransactionID, QResult,Probationtime, CorrelationID,Dhcid,VendorClass(Hex),VendorClass(ASCII),UserClass(Hex),UserClass(ASCII),RelayAgentInformation,DnsRegError.
Since DHCP is a protocol that do not need any authentication from the client, any clients within the network can obtain a lease for an IP. It is good housekeeping to monitor and be on the lookout for strange hostnames and unknown or unidentified vendor MAC addresses, to monitor what is accessing the network.
[1] https://www.elastic.co/guide/en/beats/packetbeat/master/exported-fields-dhcpv4.html
[2] https://handlers.sans.edu/gbruneau/elk/logstash-filter-dhcp.conf
[3] https://handlers.sans.edu/gbruneau/elk/Windows_DHCP_ilm_policy.txt
[4] https://handlers.sans.edu/gbruneau/elk/Windows_DHCP_template.txt
[5] https://handlers.sans.edu/gbruneau/elk/Microsoft_DHCP_7.11_v1.ndjson
[6] https://isc.sans.edu/forums/diary/Secure+Communication+using+TLS+in+Elasticsearch/26902/
[7] https://www.elastic.co/guide/en/ecs/1.8/ecs-field-reference.html
[8] https://handlers.sans.edu/gbruneau/elastic.htm
-----------
Guy Bruneau IPSS Inc.
My Handler Page
Twitter: GuyBruneau
gbruneau at isc dot sans dot edu


Comments
I used it at a previous job and elasticsearch and kibana (I never cared for logstash much) made me a believer in better log data. Thar's gold in them thar logs! It really is a big win for organizations without enough budget for some very, very pricey SIEM solution. :-)
Anonymous
Mar 13th 2021
5 years ago