KAPE: Kroll Artifact Parser and Extractor
KAPE vs Commando, another Red vs Blue vignette
Once in awhile the Twittersphere really sends me signal regarding content opportunities and potential research areas. If you follow any Blue Team aficionados, as I do, you’ll likely have seen the same level of chatter and excitement I have regarding Eric Zimmerman’s KAPE, the Kroll Artifact Parser and Extractor. In short, KAPE is a triage program to target devices or storage locations, find forensic artifacts, and parse them.
Introduction
On the heels of last month’s discussion regarding Commando VM, the system I implemented for that review serves us well to pit KAPE versus Commando. To do so, I self-pwned and conducted adversarial activity using the Command tool set, then utilized KAPE’s intrinsic triage, identify, and parse capabilities.
Before the red versus blue walkthrough, a few key elements. KAPE documentation is extensive, comprehensive, and effective. I’ll not belabor our time here replicating much of what Eric has produced, as always read this documentation before going too far in your KAPE testing and implementation.
Updating KAPE is as easy as
Get-KAPEUpdate.ps1
from a PowerShell prompt and
kape.exe --sync
from a command prompt.
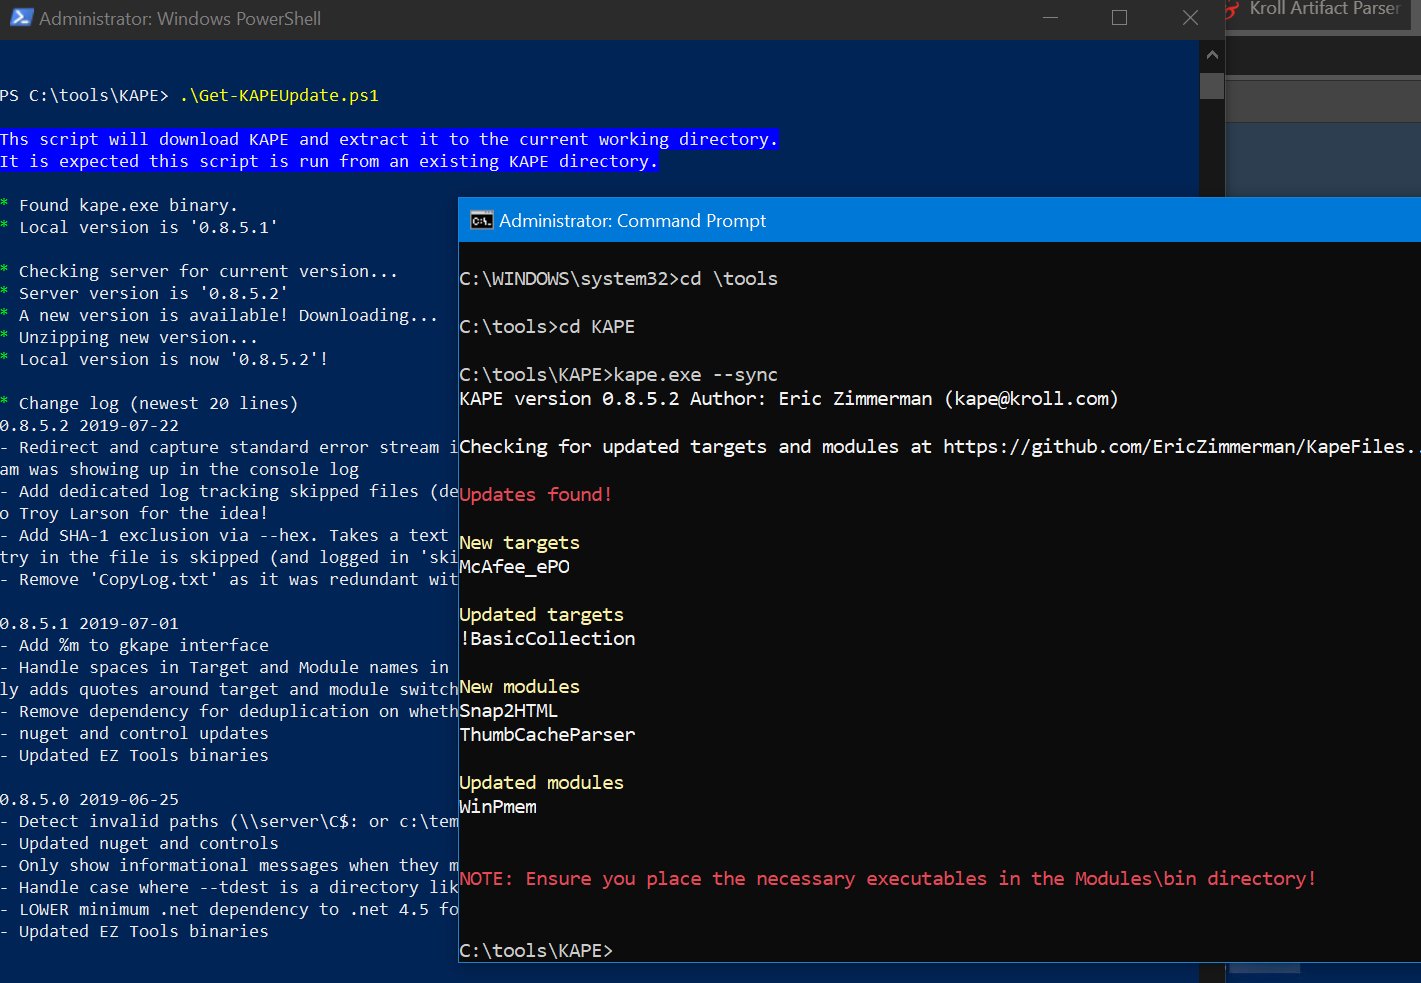
Figure 1: KAPE update
You’ll want to explore gkape, the KAPE graphical interface, simply because it will help you quickly enumerate all the target and module options, and learn how to quickly build out your commandline payloads, including a Copy command feature.
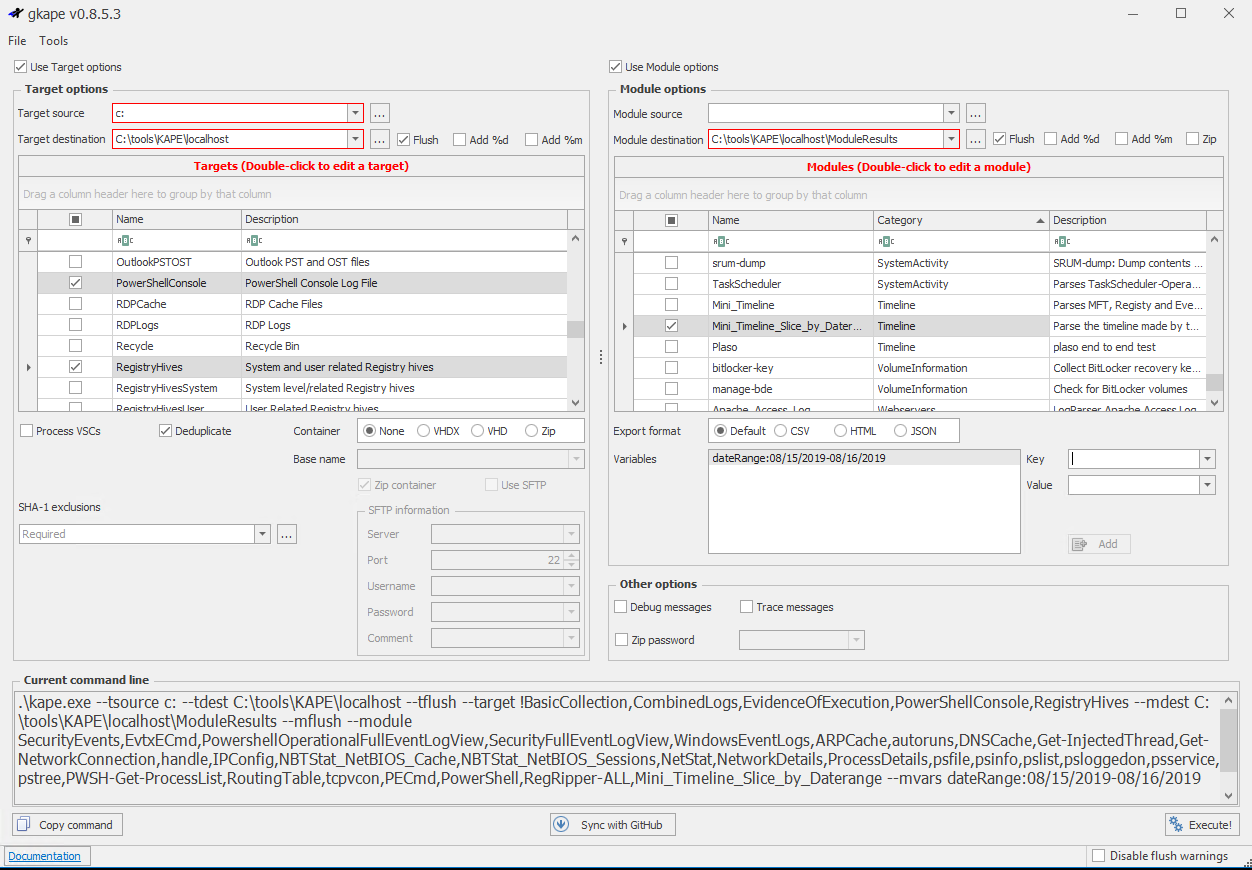
Figure 2: gkape
In scenarios such as this, I’m particularly fond of !BasicCollection, CombinedLogs, EvidenceOfExecution, PowerShellConsole, and RegistryHives as Targets. For Modules, I utilize RegRipper-ALL (Registry), PowerShell and PECmd (ProgramExecution), all the tools in the LiveResponse category), WindowsEventLogs, SecurityEventFullLogView, PowerShellOperationalFullEventLogView, EvtxECmd, all under the EventLogs category, and SecurityEvents under AccountUsage. As I was writing this, Eric added Mini_Timeline and Mini_Timeline_Slice_By_Daterange, literally as I was thinking “Boy, a timeliner module would be pretty slick.” Well done!
NOTE-MISSION CRITICAL: You will need to download tools and place them in \KAPE\Modules\bin, including RegRipper (rip.exe), tln.exe and parse.exe from @keydet89’s GitHub repo, Nirsoft and TZWorks binaries, and others you may wish to utilize. Note that you’ll need p2x5124.dll for RegRipper and the Mini_Timeline tools, it should be in the same directory with each binary. You’ll be warned amply to do so. When you execute a job, watch the shell too, missing tools will be called out purple text. You can also review the console log, found under ModuleResults, after a run.
As I ran KAPE on my same dedicated host where I installed the Commando tool set last month, I simply set C: as my Target source and C:\tools\KAPE\localhost as my Target destination. Similarly, for Modules, I left Module source blank and set C:\tools\KAPE\localhost\ModuleResults for my Module destination.

RED: Commando - SharpDump
To pit KAPE versus Commando, I went back to the GhostPack well and compiled SharpDump. GhostPack is HarmJ0y’s collection of security related toolsets, and SharpDump is a C# port of PowerSploit’s Out-Minidump.ps1 functionality. As with all the Ghostpack tools included in Commando, you must compile them yourselves, no binaries are provided. Much as we did last month with Seatbelt, utilize Visual Studio Community 2019 on , set up for Windows development (.NET, desktop, and UWP), and then open SharpDump.sln, found in C:\tools\GhostPack\SharpDump. Be sure to run Visual Studio as administrator for this step. In Solution Explorer, right-click SharpDump and select Build. You’ll then find SharpDump.exe in C:\tools\GhostPack\SharpDump\SharpDump\bin\Release.
SharpDump, when executed, will create a debug output file as seen Figure 3.
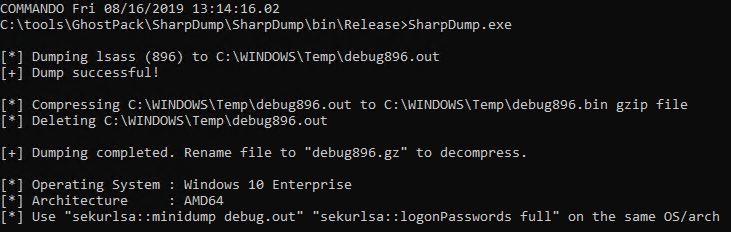
Figure 3: SharpDump
The output file is written to C:\Windows\temp, mine was debug896.bin. Move it, rename it debug.gz, and decompress it. I did so in my SharpDump directory. To finish the adversarial process, you’ll find mimikatz in C:\tools\Mimikatz\x64 on a Commando-enabled system. In the mimikatz console, I changed directory to my SharpDump release folder, and ran
sekurlsa::minidump debug896
sekurlsa::logonPasswords full
The result is seen in Figure 4.
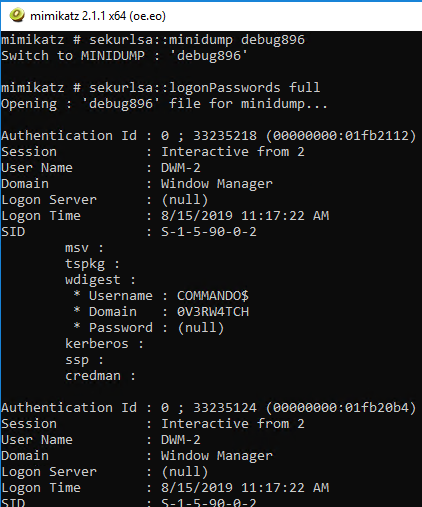
Figure 4: mimikatz
Congratulations, you have created a more than sufficient amount of malicious artifacts to identify with KAPE for the Blue part of this exploration.

BLUE: KAPE
As we’re working through an arbitrary scenario here, we already have what could be consider IOCs. Loosely translated, your threat intel or SOC team would like escalate with something akin to intel or telemetry indicating that a potential adversary likely created a dump file with all process memory to disk and used mimikatz to acquire identity artifacts. I set up a KAPE run as described above, it’s mighty quick (Figure 5).
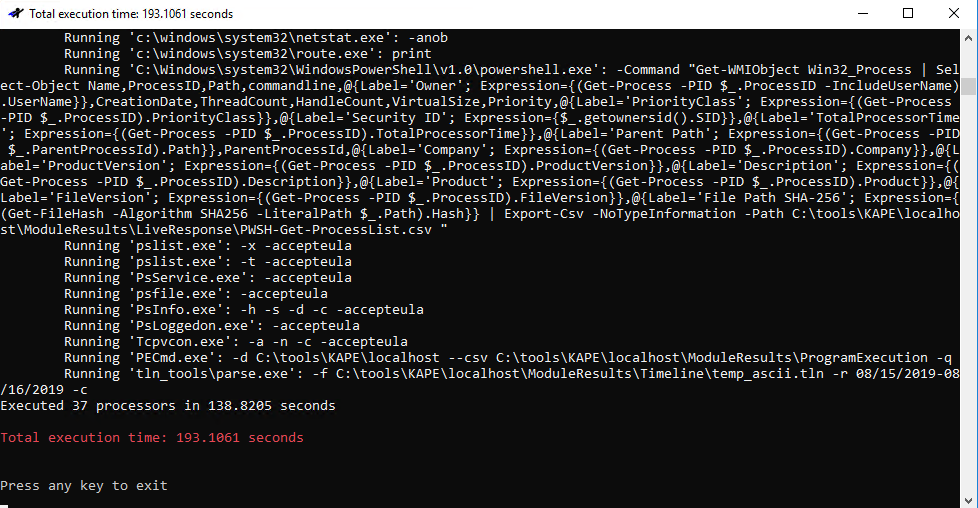
Figure 5: KAPE run
Results awaited me in C:\tools\KAPE\localhost\ModuleResults, per my configuration. Events of interest were immediately discoverable in EventLogs, LiveResponse, and ProgramExecution folders. The first artifacts of malfeasance related to our SharpDump scenario comes via results from Systinternals Handle viewer results found in LiveResponse. Prior the actual execution of SharpDump the adversary (me, knucklehead that he is) chose to compile SharpDump on the same system. ;-) Visual Studio creates a SQLite database in the compiled project folder. Figure 6 reveals all the related handles entries.
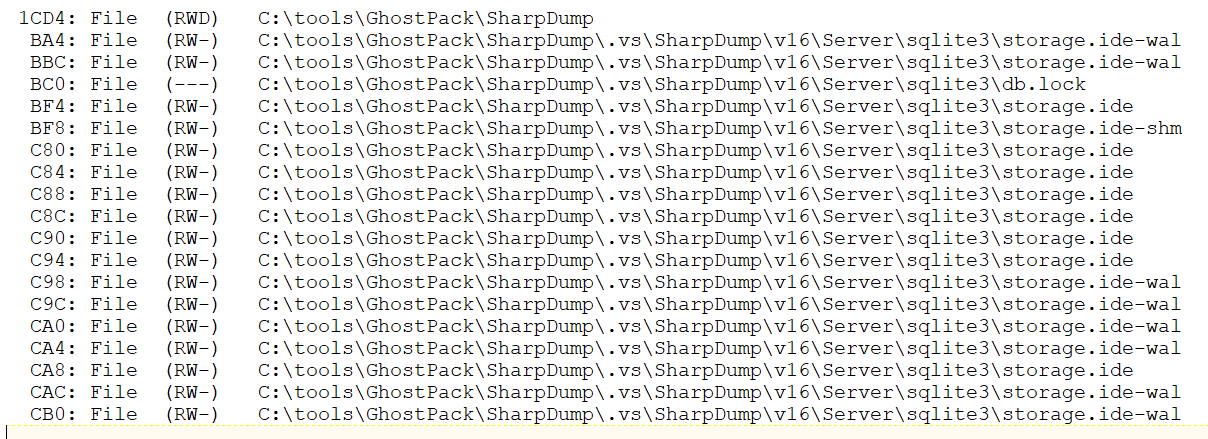
Figure 6: SharpDump handles
As an analyst/investigator, I consider timeline data absolutely essential. Eric’s PECmd results flourish in this regard. From ProgramExecution output, 20190817003023_PECmd_Output_Timeline.csv revealed the following entry, from many:
8/16/2019 21:04,\VOLUME{01d530564cd90cbb-a64cf119}\TOOLS\MIMIKATZ\X64\MIMIKATZ.EXE
8/16/2019 20:14,\VOLUME{01d530564cd90cbb-a64cf119}\TOOLS\GHOSTPACK\SHARPDUMP\SHARPDUMP\BIN\RELEASE\SHARPDUMP.EXE
This is spot on given that, when in red mode, I compiled SharpDump then walked away for almost an hour before coming back to run the dump through mimikatz.
Need more magic from full PECmd output? The full entry from 20190817003023_PECmd_Output.csv of the 21:04 mimikatz execution is evident in Figure 7.
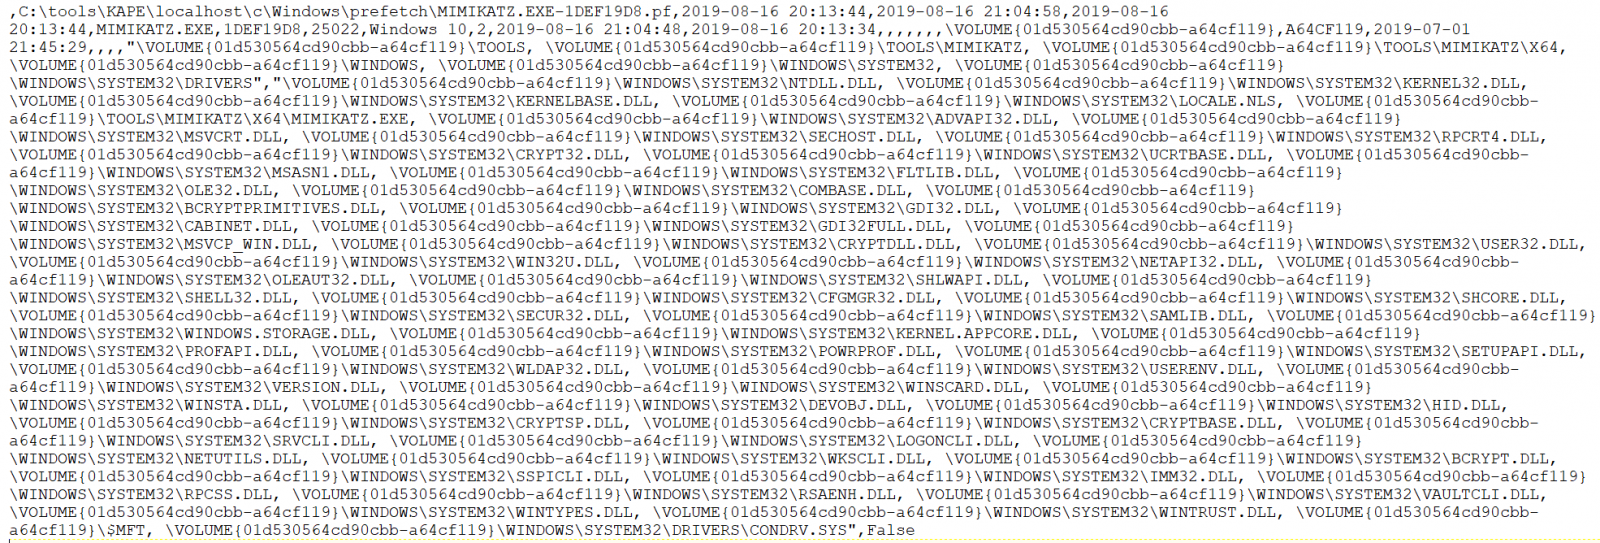
Figure 7: PECmd mimikatz details
If you’ve enabled verbose PowerShell logging (if you haven’t, shame on you) such that you get all the juicy details in Windows\system32\winevt\logs\Microsoft-Windows-PowerShell%4Operational.evtx you’ll find glorious results in EventLog, 20190817002759_EvtxECmd_Output.csv in my case. Related results seen in Figure 8.

Figure 8: EventID 4104
Behold the beauty of a snippet from a full content EventID 4104, with a whole lotta mimikatz. :-) Did I mention that turning on PowerShell logging yields invaluable results? Yes, I did, but let me really drive the point home with an additional scenario.
RED: Commando - PowerSploit tests
I love PowerSploit, and so do a plethora of jackelope script kiddies. Ever investigated compromised systems that have been stomped by really loud, really unsophisticated interlopers? I thought I’d make the point in similar noisy fashion, in the most simpleton manner. The PowerSploit framework includes an outstanding test suite to determine module success and failure. I lit the test suite up on my victim as seen in Figure 9.
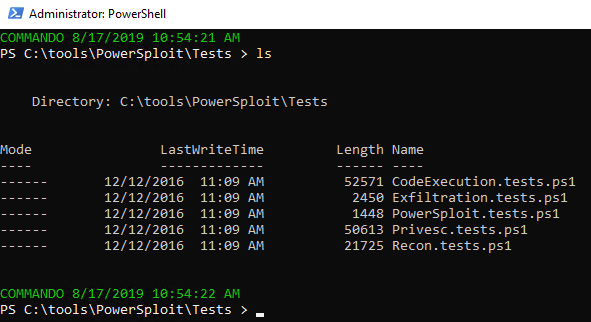
Figure 9: PowerSploit test scripts
The results were noisy, noisy, noisy, and again, with verbose PowerShell logging, a wonderful way to highlight a related KAPE module.
BLUE: KAPE
With verbose PowerShell script block logging enabled throughout your enterprise, you can spot a good bit of up-to-no-good. On the heels of the PowerSploit test scripts, I ran the following seen in Figure 10 to see what turned up. It runs Nirsoft’s Full Event Log Viewer.

Figure 10: KAPE full event viewer config
The results, as expected, write to the EventLogs folder, as full_powershell_operational_event_log.csv.
The first hit in the results sums things up nicely. As part of the PowerSploit recon test suite, Invoke-StealthUserHunter was tester. In my case it failed and threw an error, but a small snippet of the entry from the PowerShell operational event log follows in Figure 11.
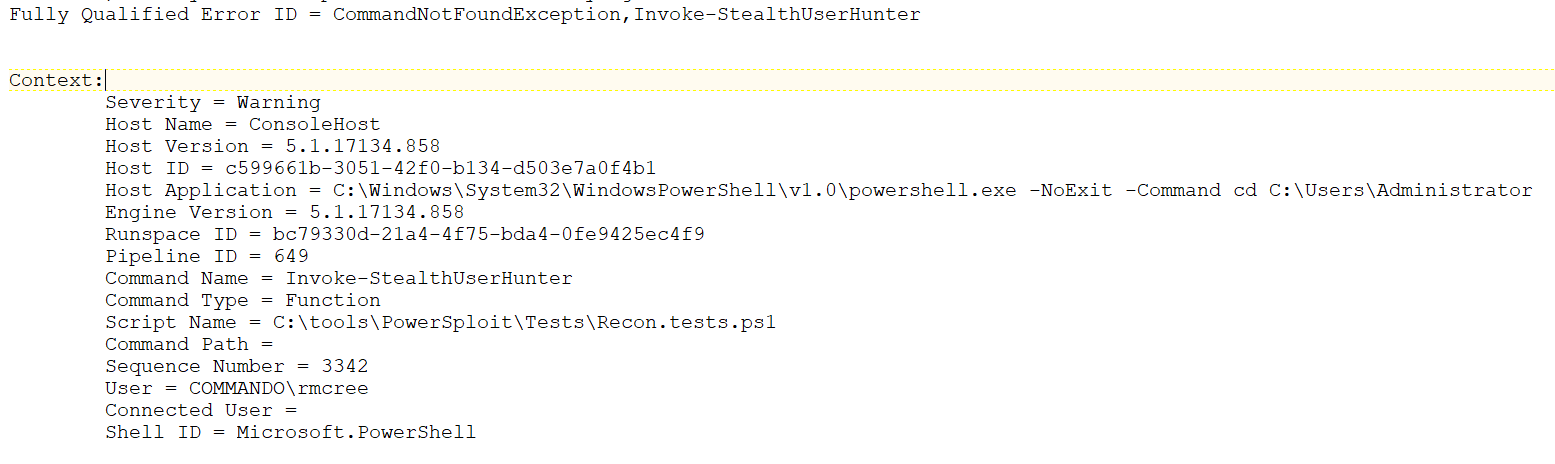
Figure 11: KAPE full event viewer results
As you can imagine, with the PowerSploit test suite, there were plenty of script block logs entries to follow. If your adversary attempts to used PowerShell modules from any of the well-known offensive PowerShell frameworks, you will spot them with PowerShell script block logging and KAPE during investigations. You should also be building detections on PowerShell specific indicators found via script block logging.
Conclusion
A few takeaways:
Read the actual module script content by double-clicking them in gkape. You’ll learn a lot, and it can help debug configurations as well. KAPE is a beast. To be fair, I did it almost no justice here, these are painfully simple scenarios. But I do hope they served to kick in your intrigue and lead you to exploring Eric and team’s magnificent work. Have fun, there are endless options, configurations, and opportunities come in behind Red Team and clean up all their rainbow unicorn skittles doodie.

Blue Team, you rock.
Cheers…until next time.


Comments