Packet Captures Filtered by Process
Already you're thinking, did I read that right? The answer is nope, you absolutely can capture by Windows Process, just not with Windump or Wireshark. A while back I wrote a short diary about using NETSH to capture packets ( https://isc.sans.edu/diary/19409 ), and this story builds on that one.
A quick recap - to capture packets using NETSH, for a basic capture you'd do something like:
netsh trace start capture=yes tracefile=c:\temp\trace.etl
Then to stop the capture, execute:
netsh trace stop
Before we proceed, get the process details for the app you are trying to track. Some thing as simple as:
tasklist > tasklist.out
will give you the list of windows processes and the process numbers.
You can get much more detail from sysinternals tools like Process Monitor, or better yet, Process Explorer. In this screenshot (from Process Explorer) we see that Citrix Receiver client actually is 5 running processes at the moment on my machine.
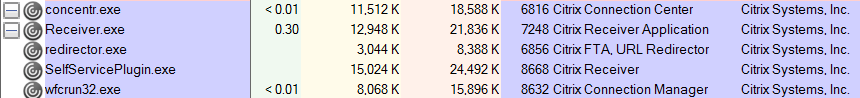
And Cisco AnyConnect has 2 (vpnui and vpnagent)

In this case I'm chasing the packets from Cisco's AnyConnect VPN client. In the Process Explorer screeshot above, the associated processes are mixed in with those from the legacy IPSEC VPN client. This is easy enough to filter out in Wireshark if you know what the process does, but what you are looking for in a lot of cases is what *else the process is doing?" Is it phoning home for updates? Is it phoning home to share information that you don't want shared? For a VPN client you know what you are connecting to (so that part is easy to filter if you were using Wireshark), but what else is it doing?
On to analyzing the captured data by application or process. Instead of exporting the whole works to pcap format, open the NETSH output in Microsoft Message Analyzer, Microsoft's awesome succesor to the venerable NETMON that many of us have used over the years.
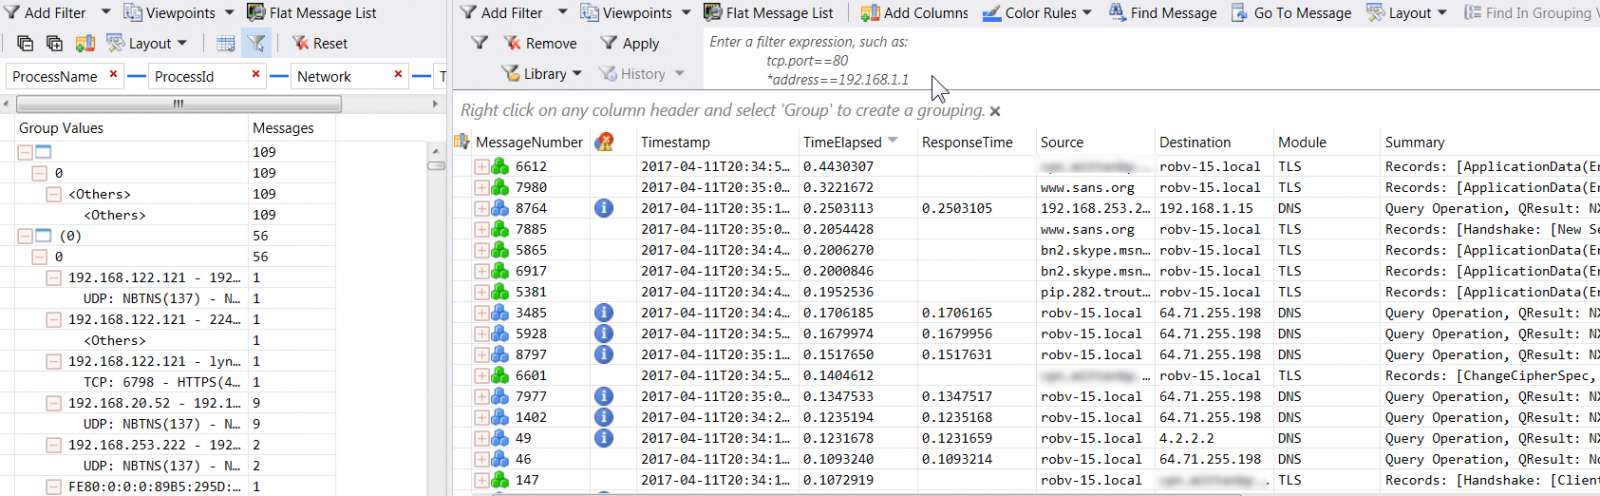
The right had pane looks pretty familiar, complete with a "network tuple" style filter at the top. The left hand pane however is where we're looking today. That's what I call the "filter by other stuff" window. Let's trim the criteria down to the Process Name and Process ID (or you could just pick one or the other, it comes to the same thing since each process name has a unique process number).
Now, pick the target application, and the associated messages will appear in the right hand pane. Wait, messages? Yes, what you'll see in the right hand pane is a mix of packets in and out of the application, as well as the Windows Events that are generated by the application - bet you weren't expecting that?
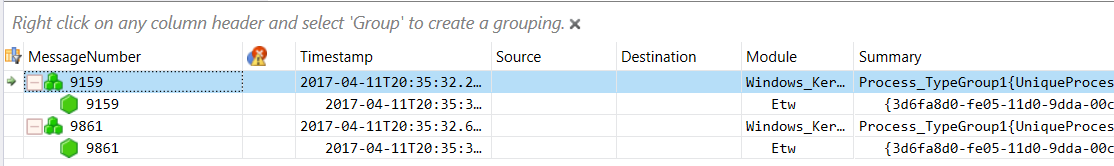
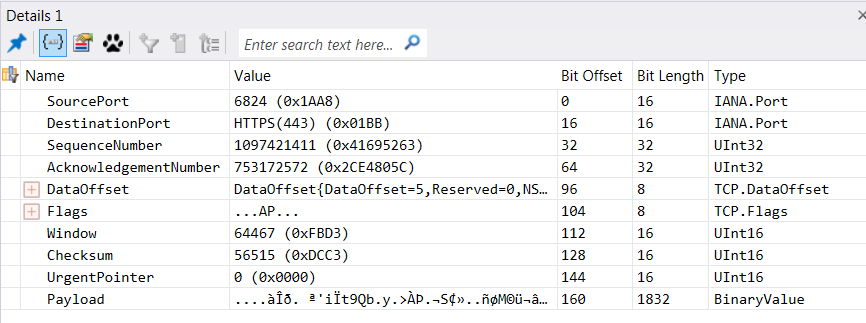
If you click on a message, you'll see associated message details:
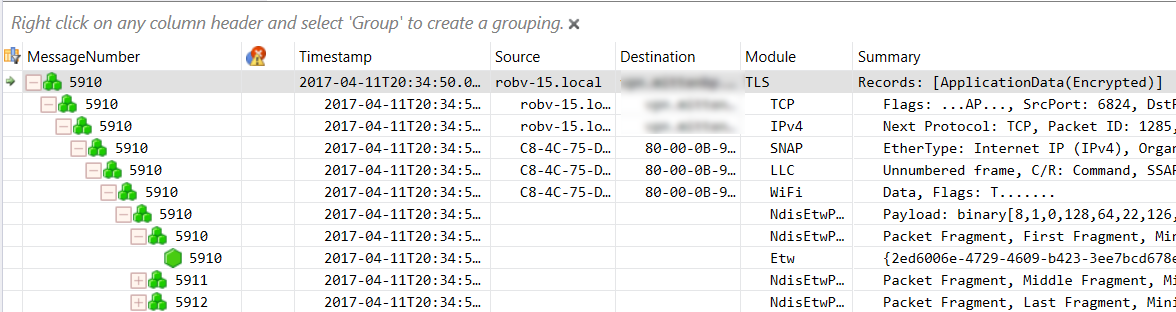
You see in the screenshot below that each packet is broken up heirarchally like you'd expect - my VPN traffic is fully represented, right down to the 802.11 wireless frames that are associated with the application. In OSI speak, as you click on each "layer" in the packet or frame, you'll see the detail in the window directly below.
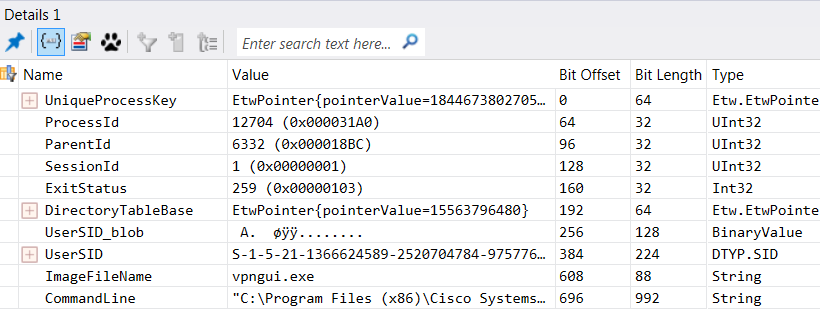
And as you'd expect, clicking any of the "layers" above gives you more details:
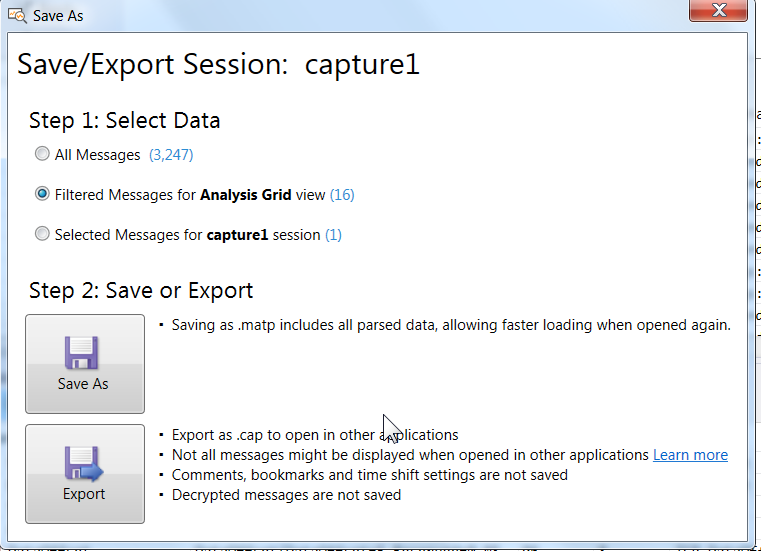
Want to export to pcap format? You can write a filter for the display window, or simply highlight a number of records, then choose File / Save As / Export. I found that it was pretty easy to confuse the export process - a few null content files got me past this, it does work nicely. Just don't expect Wireshark to consume the Windows Event data.
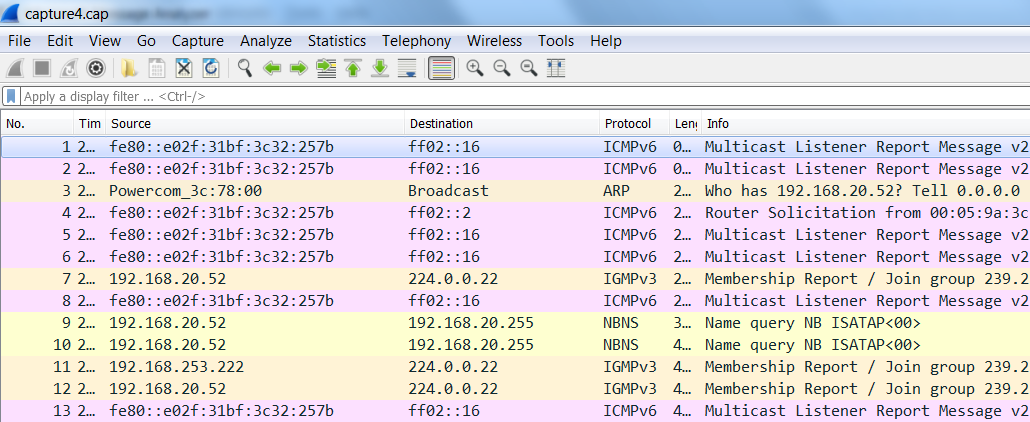
Then simply open the resulting CAP file in Wireshark or whatever "analyze the pcap" tool or script you need to continue your analysis (the traffic shown here is idle traffic routing through the tunnel):
This is a very basic example - I'm just starting with Message Analyzer. There seems to be no end to how deep you can dig into the data with this tool though, and the interface is pretty straightforward - call me crazy, but for some things I might end up preferring it over Wireshark! Though my CLI bias is still firmly in place - TCPDump and other CLI/scripting tools are still my solid go-to once there's more than a few thousand packets.
Next chance I get I'm digging into how PowerShell can be used to work some automation goodness into this process. More on this here:
https://technet.microsoft.com/en-us/library/dn456518(v=wps.630).aspx
https://blogs.technet.microsoft.com/messageanalyzer/2013/10/29/using-powershell-to-automate-tracing/
Lots of MS Message Analyzer tid-bits can be found at: https://blogs.technet.microsoft.com/messageanalyzer
Have you done something way cool with Message Analyzer? Please, share using our comment form!
===============
Rob VandenBrink
Compugen


Comments