Guest Diary: Dylan Johnson - There's value in them there logs!
[Guest Diary: Dylan Johnson BSc.CISSP] [There's value in them there logs!]
Today we bring you a guest diary from Dylan Johnson where he shows us a really cool way to aggregate logs into one place, search, trend, analyze in realtime and graph.
Events in Logs tell a story and are invaluable as a data source. Logs can be used as a source to create complex instrumentation, aid with root cause analysis, and provide real time analysis, during a security incident for example and a plethora of other uses such as trend analysis and forecasting. One of the problems with logs is their non standard use of timestamps, so if you want to correlate across logs you need some pretty tasty regular expression skills. It would be great if your search terms dealt with a single time stamp format and could also query the intrinsic values in all of these logs, across multiple machines, in real-time and with trending information + time series data. Sounds like a big ask for free? Read on!
This diary slot is not large enough to go into any great detail, however I wanted to share a event management framework that concerns itself with shipping, normalisation, filtering, output, time series data and trending of data in log files, from here on referred to as events.
Below is the architecture:
.jpg)
Lets look at the architecture above as there a fair amount of independent moving parts.
Logstash is a stupendous Java application created by Jordan Sissel (see www.logstash.net) which takes data from multiple sources such as file, syslog, message queues, pipes etc and gives you the power to splice and dice, top and tail and mangle this data or event stream via filters (more on these later) and importantly gives each event a standard time stamp. Once you have filtered or normalised your data Logstash gives you plenty of output options for this data such as Elasticsearch, email, graphite and Nagios. So in a nutshell Logstash takes your event streams, does stuff to them and outputs them somewhere useful. This architecture utilises the Elasticsearch output filter (www.elasticsearch.org) an extremely fast, scalable database with Lucene (http://lucene.apache.org/core/) built in for good measure. You can query Elasticsearch via simple REST based calls. As you can see we use Kibana (www.kibana.org) as the query interface and its great as you will see later. There is also Graylog (www.graylog2.org) and one thing to note about Graylog is that is has alerting a feature currently missing in kibana.
Statsd is an aggregation service that listens for events from the Logstash Statsd (https://github.com/etsy/statsd/) output plug-in, counts the events up over time and emits them to graphite (http://graphite.wikidot.com/), a real time scalable time series data application.
One last tool to mention is GROK. GROK is utilised in Logstash filtering, its goal is to bring more semantics to regular expressions allowing expression of ideas rather than complex syntax. (http://code.google.com/p/semicomplete/wiki/GrokConcepts) There is a great tool to help with creating your GROK filters here (http://grokdebug.herokuapp.com/)
Here is a simple Logstash.conf file that reads in an Apache log from a file, parses all of the fields from each event in the log and outputs to Elasticsearch and Graphite. You can find more information on Logstash.net and there is a big community offering support on IRC Freenode.net #logstash
input {
file {
type => "Apache"
path => ["/var/log/httpd/access_log"]
}}
filter {
grok {
type => "Apache"
patterns_dir => "/data/syslog_inbound/grok_pat"
pattern => "%{COMBINEDAPACHELOG}"
}}
output {
elasticsearch {
bind_host => "0.0.0.0"
}
statsd {
increment => "Apache.Verbs.%{verb}"
}}
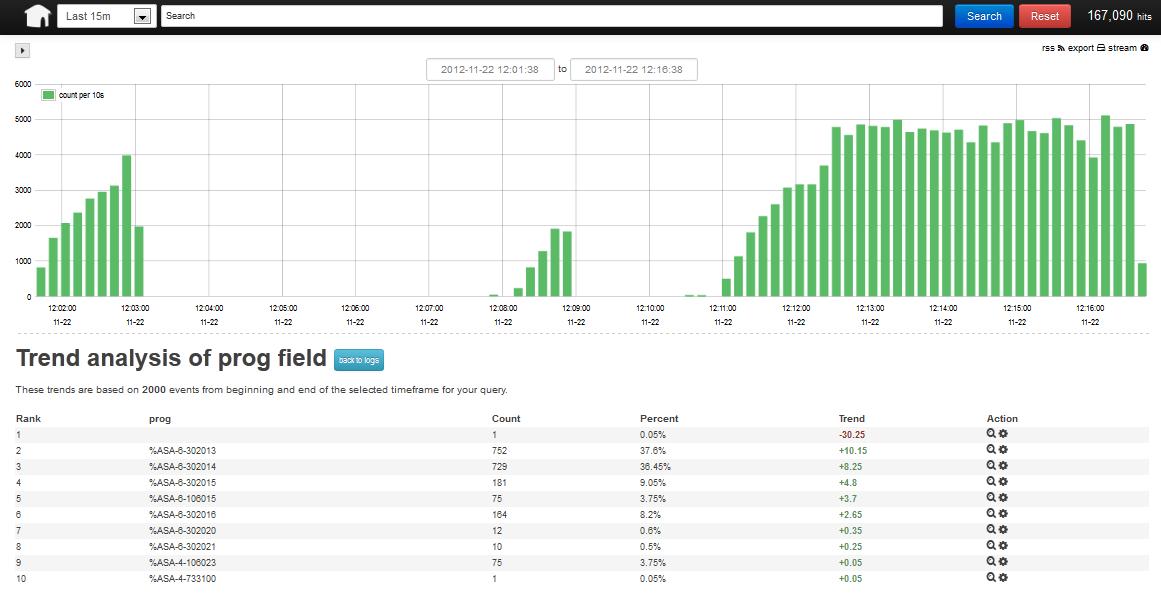
As you can see the pattern %COMBINEDAPACHELOG is doing some pretty powerful stuff. Its breaking the log up into its constituent parts. This is really useful if you want to get trending metrics from Elasticsearch. For example, tell me what hosts are trending up and down for GETS or 404's etc.
To end on here are a few screen shots showing what you get from all of this effort.
Trending
Output to Graphite via Statsd
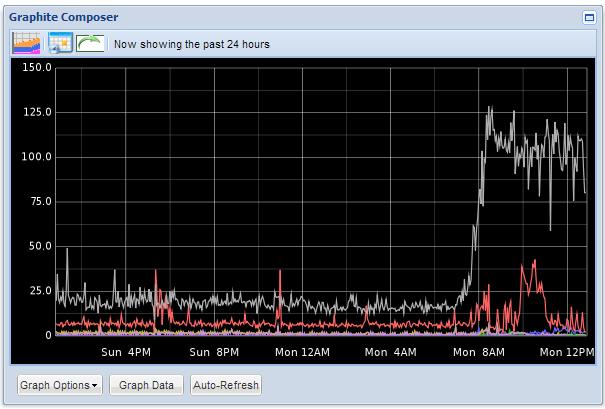
Base Line Stats
.jpg)
We have only just scratched the surface here! The framework detailed has limitless potential to solve many complex security event management problems. I hope this has given you an idea of what can be achieved with a bit of research and hard work.
Post suggestions or comments in the section below or send us any questions or comments in the contact form on https://isc.sans.edu/contact.html#contact-form
--
Adam Swanger, Web Developer (GWEB, GWAPT)
Internet Storm Center https://isc.sans.edu


Comments